OTT advertising seems to be a safe bet right now. Brands are moving serious budgets here to reach a wider segment of audience at once.
In 2025, 28% of total digital ad spend in India was heavily driven towards OTT platforms and video content. (Source: Exchange4Media)
But what if we told you that the audience pool that you are reaching right now is limited? The numbers that you see on your dashboard are not always true.
This is exactly what came to light during a recent campaign analysis we conducted for a large automotive brand running video ads across two of India’s leading OTT platforms. We went beyond what the platform reported and validated what was actually happening at the delivery level. Over 756 million ad requests were reviewed across three months.
Here’s what the data revealed, and what it means for every marketer running branding campaigns on OTT today.
The Scale of the OTT Advertising Campaign & Why It Matters
The campaign ran across two major OTT platforms simultaneously, covering both CTV and mobile inventory. It covered multiple brand lines, from regional language campaigns tied to popular content properties, to national-market brand pushes. In total, over 756 million ad requests were reviewed during the assessment period.
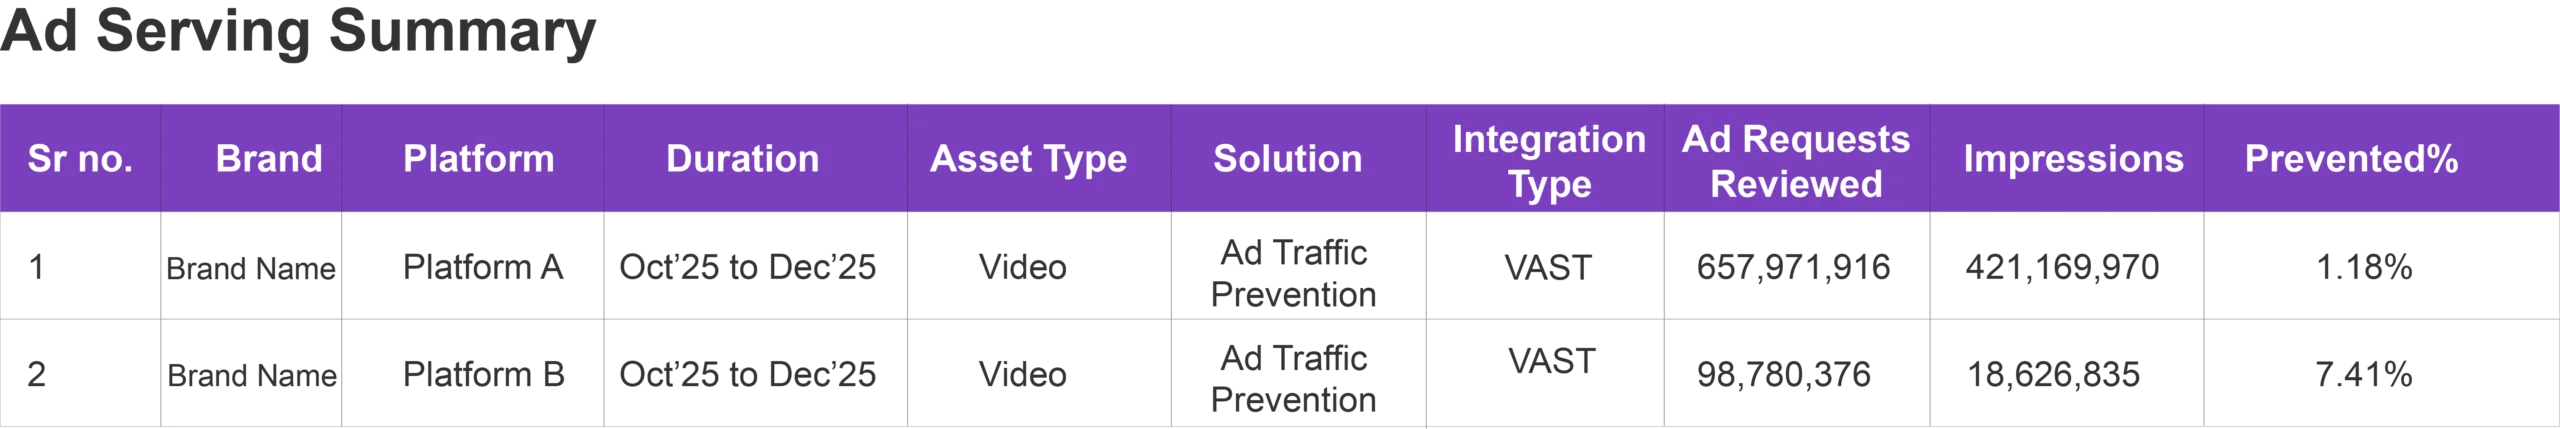
Across Platform A, 1.18% of ad requests were blocked before delivery. However, the figure was significantly higher at 7.41% for Platform B.
This gap between the two platforms is not incidental. It reflects differences in inventory quality, frequency capping behavior, and bot traffic patterns.
Finding 1: Frequency Capping Violations – The Reach Problem Hiding in Plain Sight
A frequency cap exists for two reasons:
- To protect the viewer from ad fatigue
- To protect the advertiser from burning budget on an audience that has already been saturated.
When it is not enforced at the delivery level, both goals fail simultaneously.
In this campaign, frequency overshoot was the single largest driver of blocked impressions, particularly on one of the two platforms, where it ran as high as 8.32% in a single month.
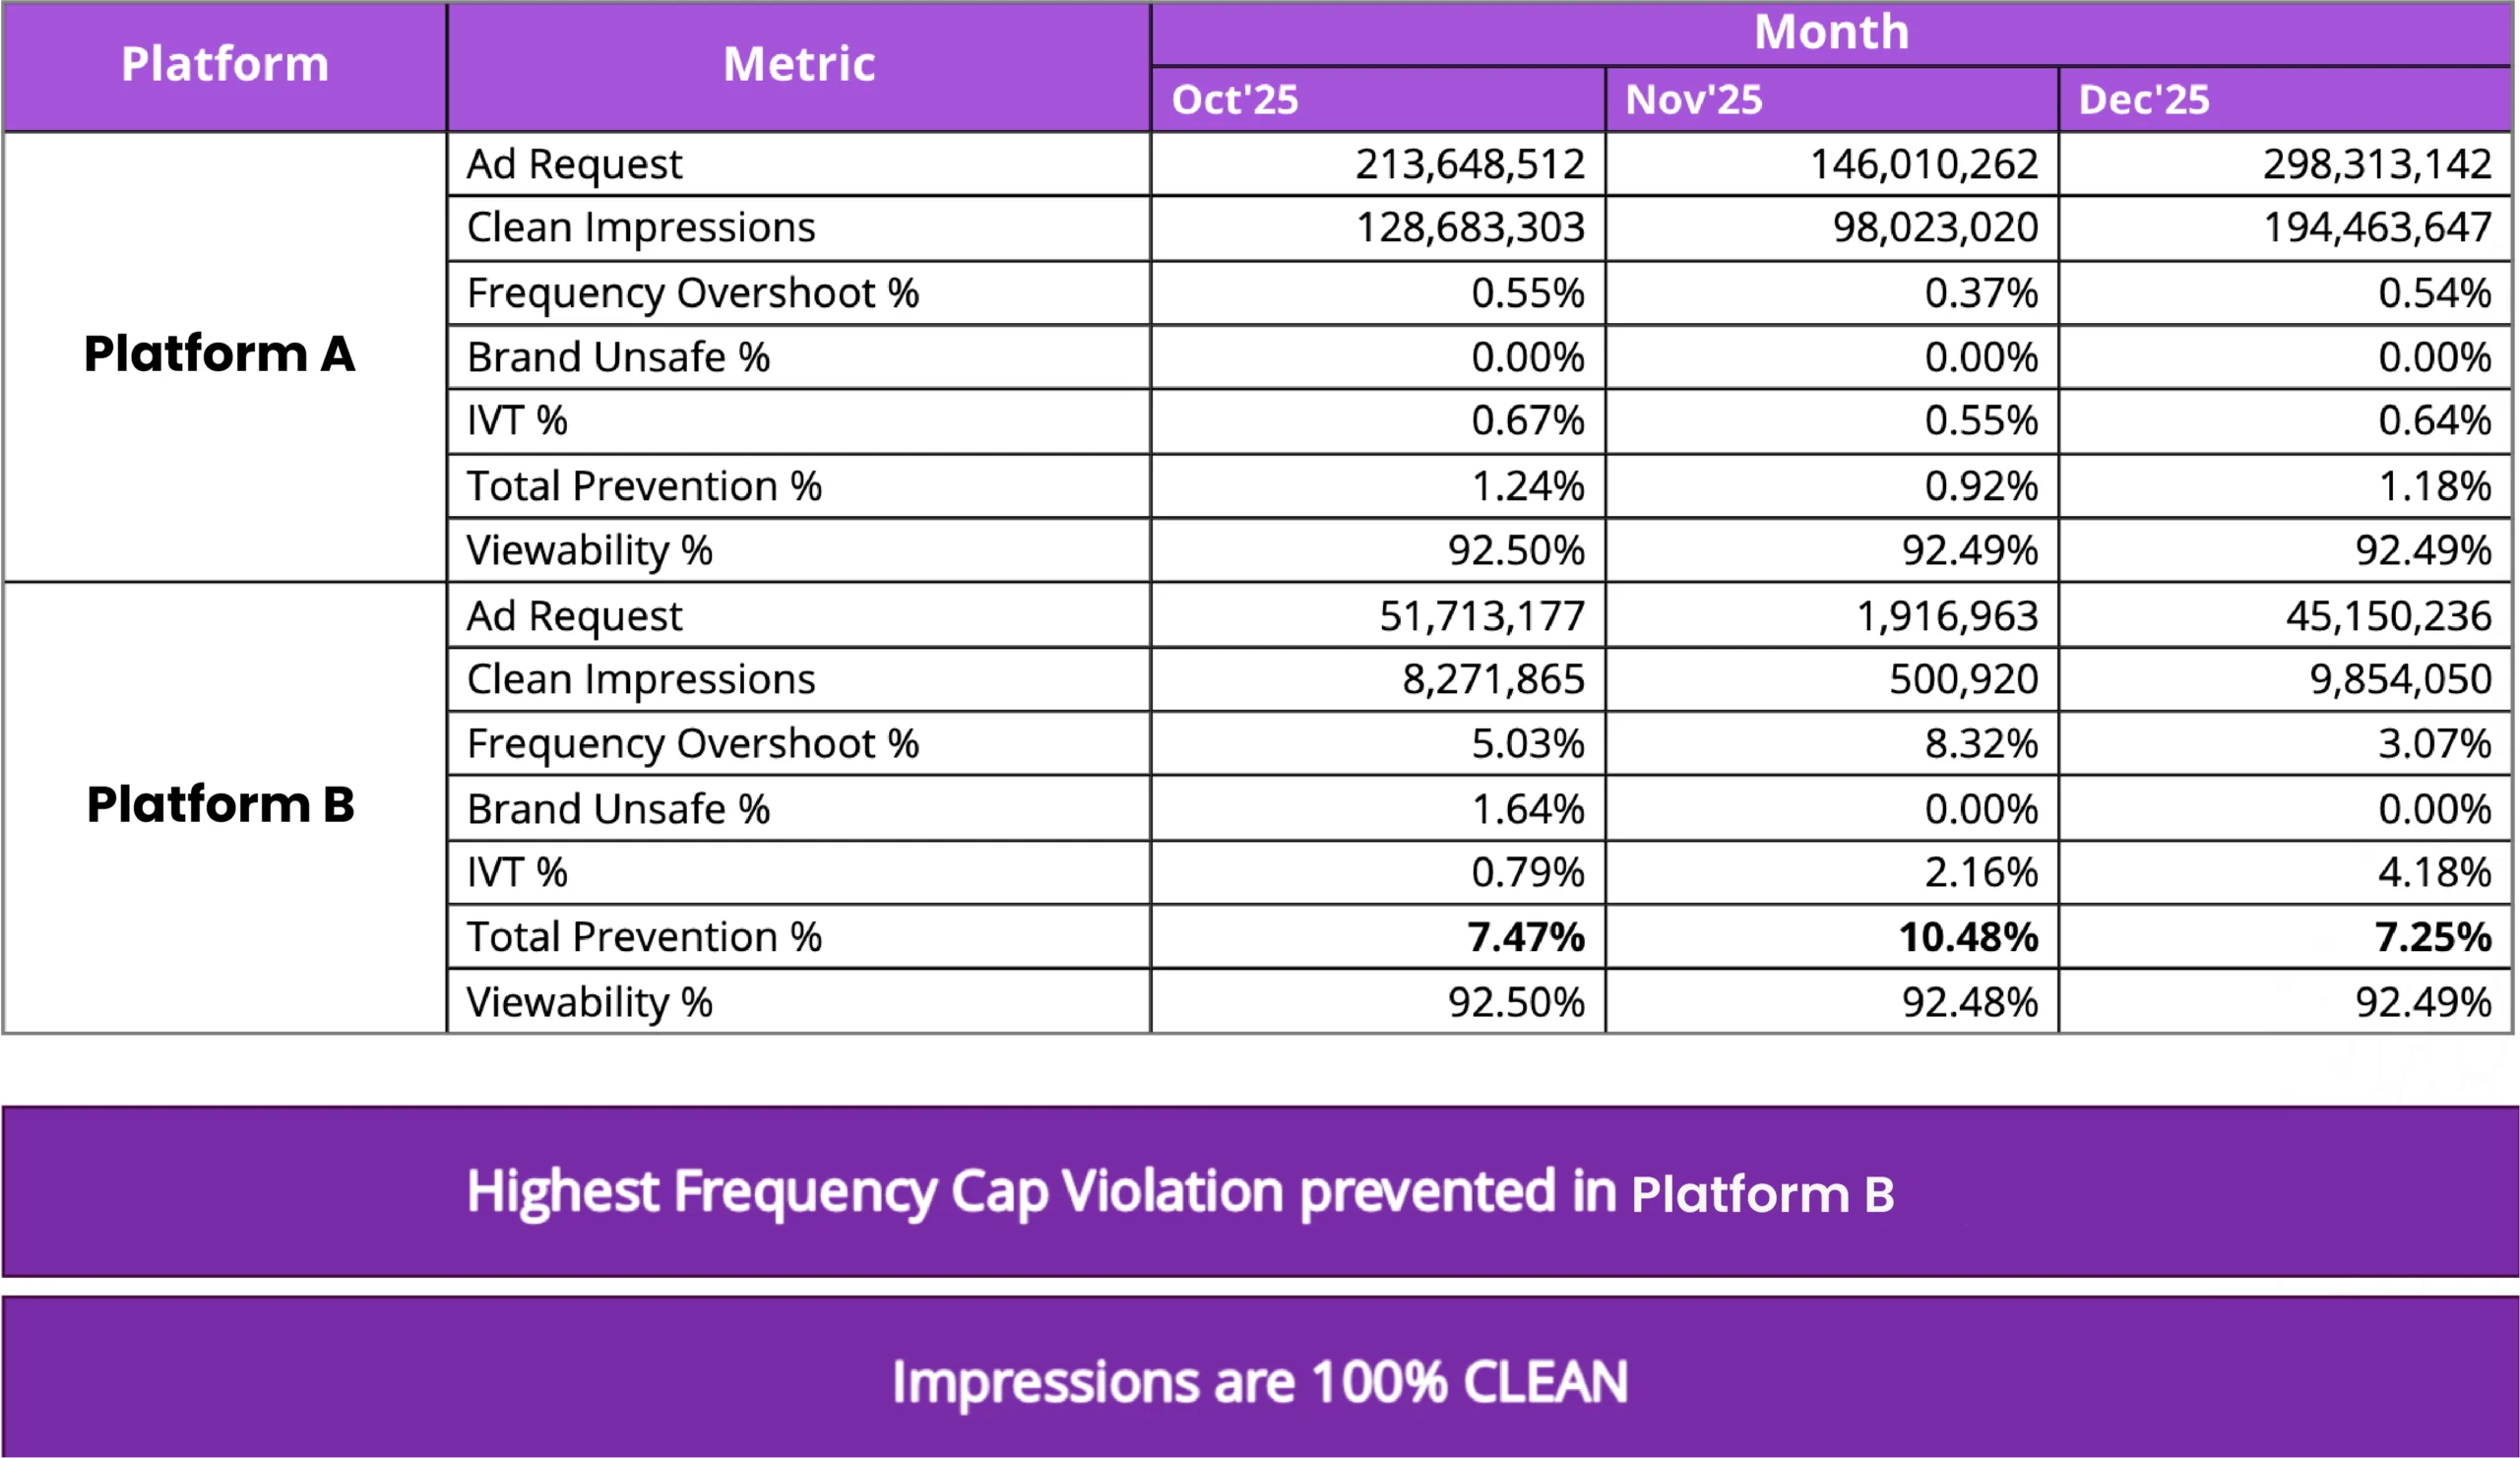
At the device level, the problem was even more stark. A single CTV device was found to have accumulated 711 ad requests over a span of just 10 days, against a defined frequency cap threshold of 3 impressions per device. Multiple other devices on the same campaign showed repetition counts ranging from 245 to 510 requests across the same period.
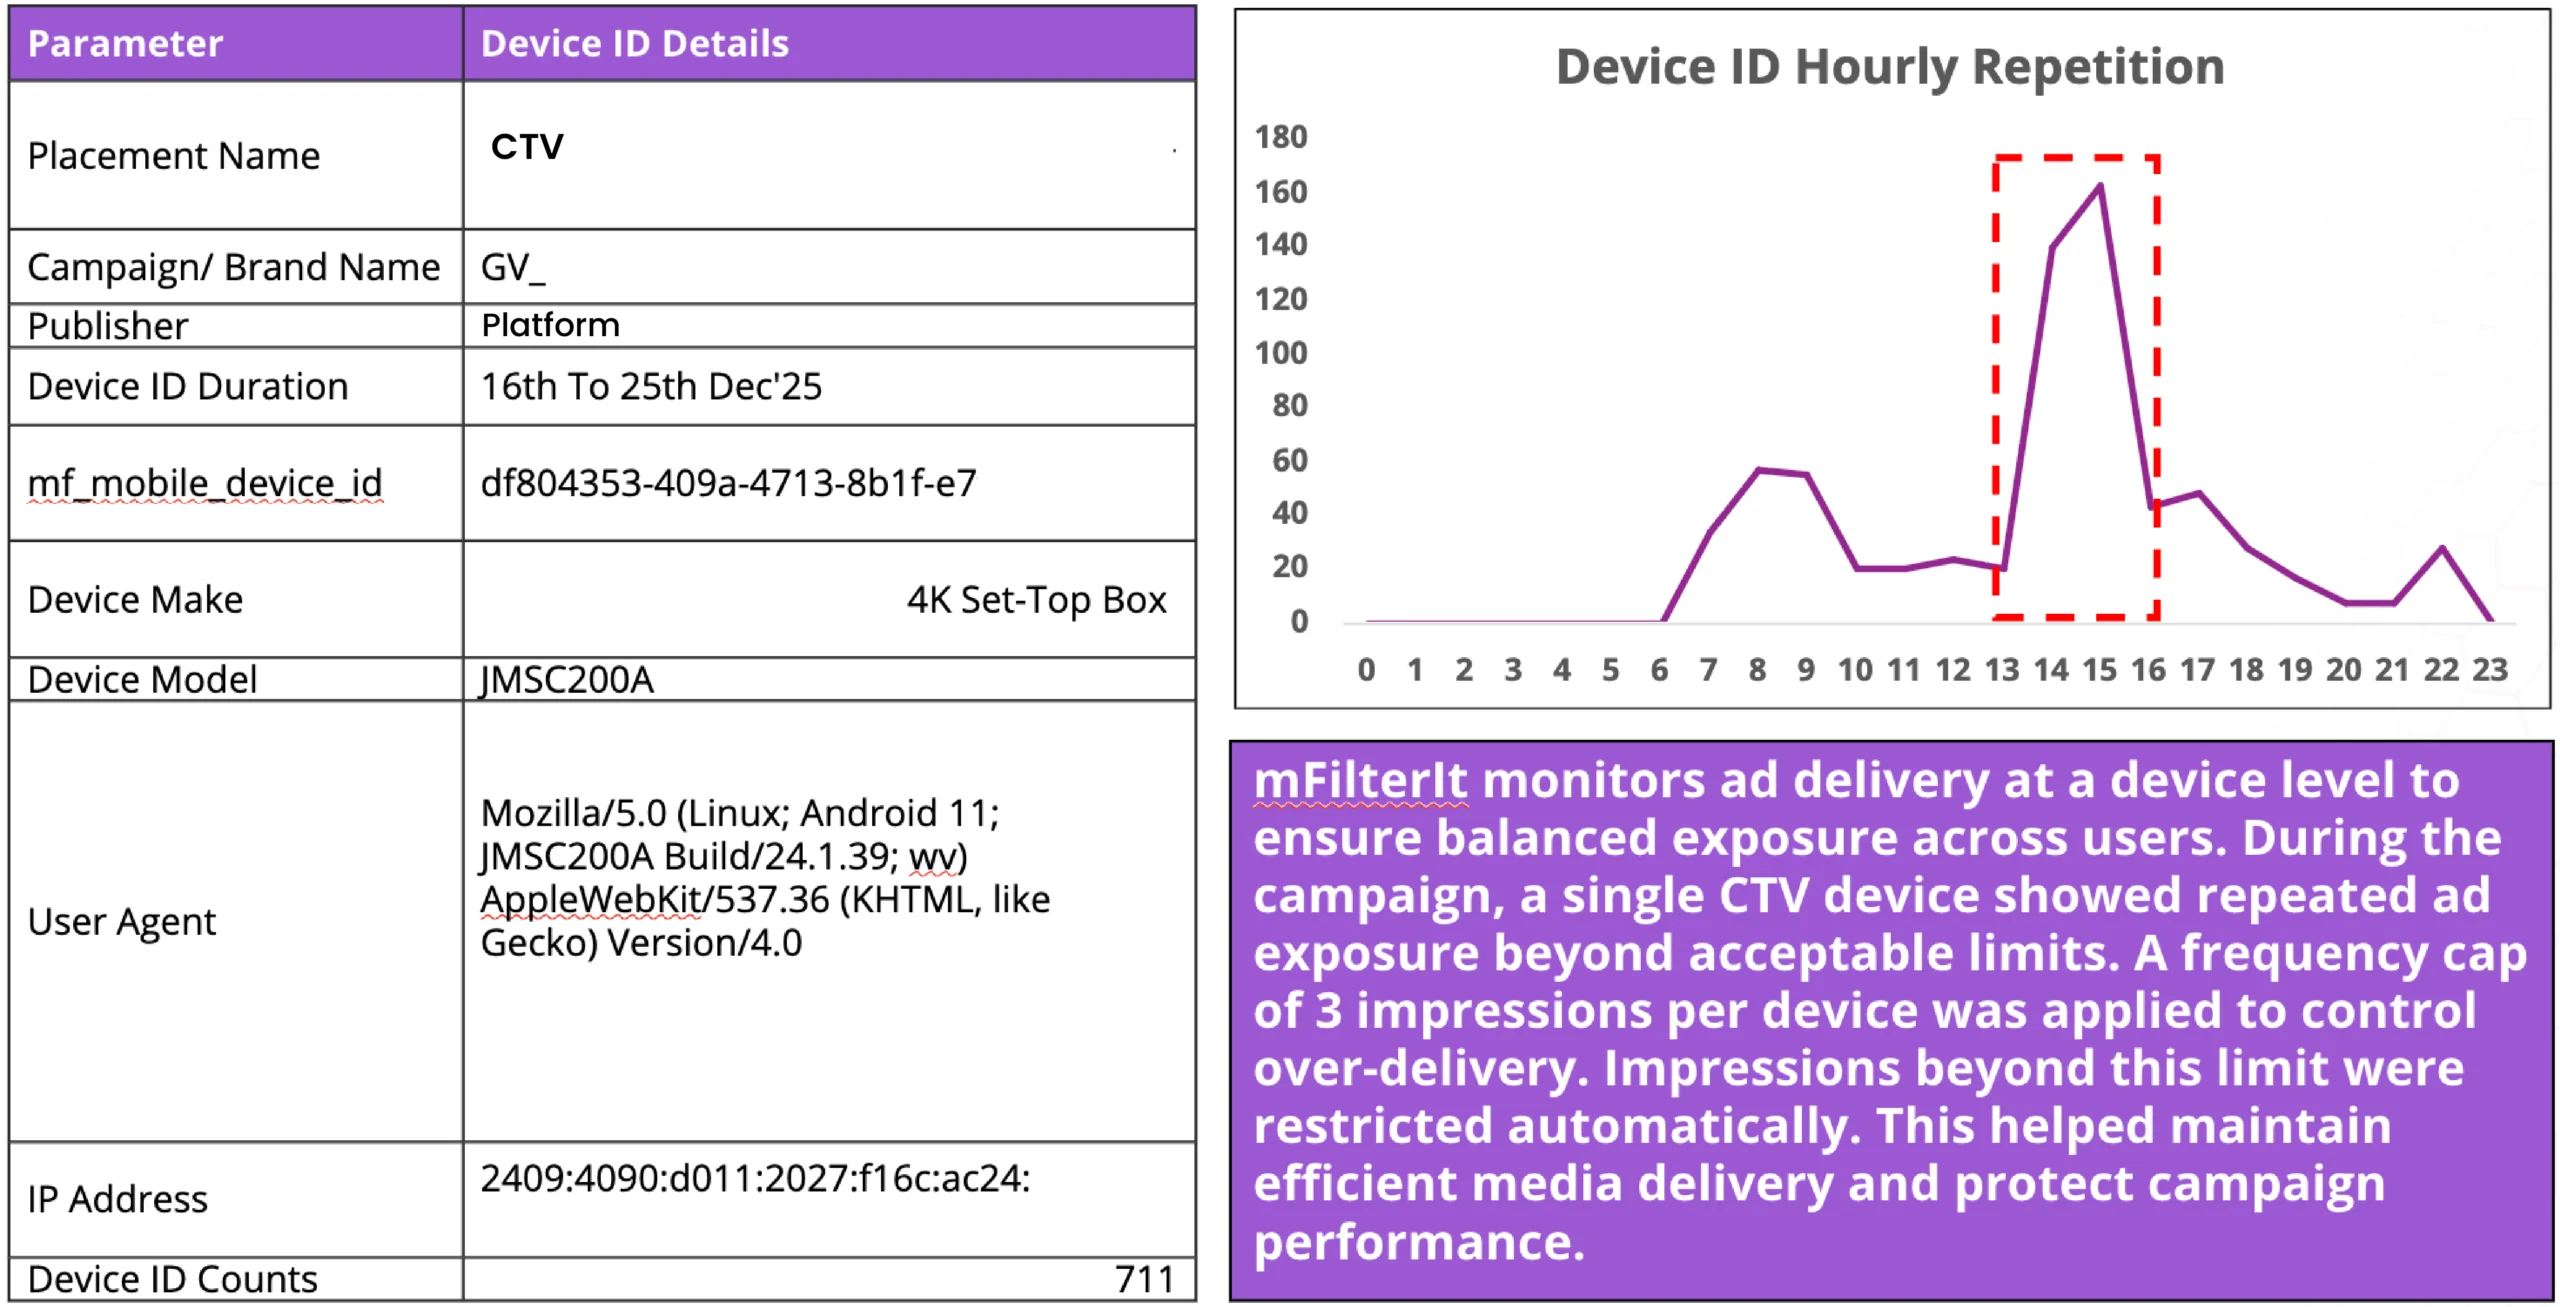
Action Taken to Prevent Frequency Capping Breaches
Every ad request was evaluated in real time against the predefined frequency capping before the impression was served. When a device had already crossed its exposure limit, the ad request was blocked automatically.
Impact
- Impression delivery shifted from repeatedly exposed devices to a new audience base.
- Budget was redirected toward incremental reach.
- Reach distribution became more balanced across devices.
- Every counted impression met the defined frequency and traffic quality thresholds
Finding 2: Brand Safety – What Content Were the Ads Actually Running Against?
Brand safety on OTT is not a binary condition; it depends on what specific content a particular ad placement is running against, and whether anyone is actually checking.
During this campaign, content-level placement analysis was conducted using Video ID signals available from the platforms. It revealed that a portion of ad impressions were being served alongside content that no automotive brand would knowingly approve.
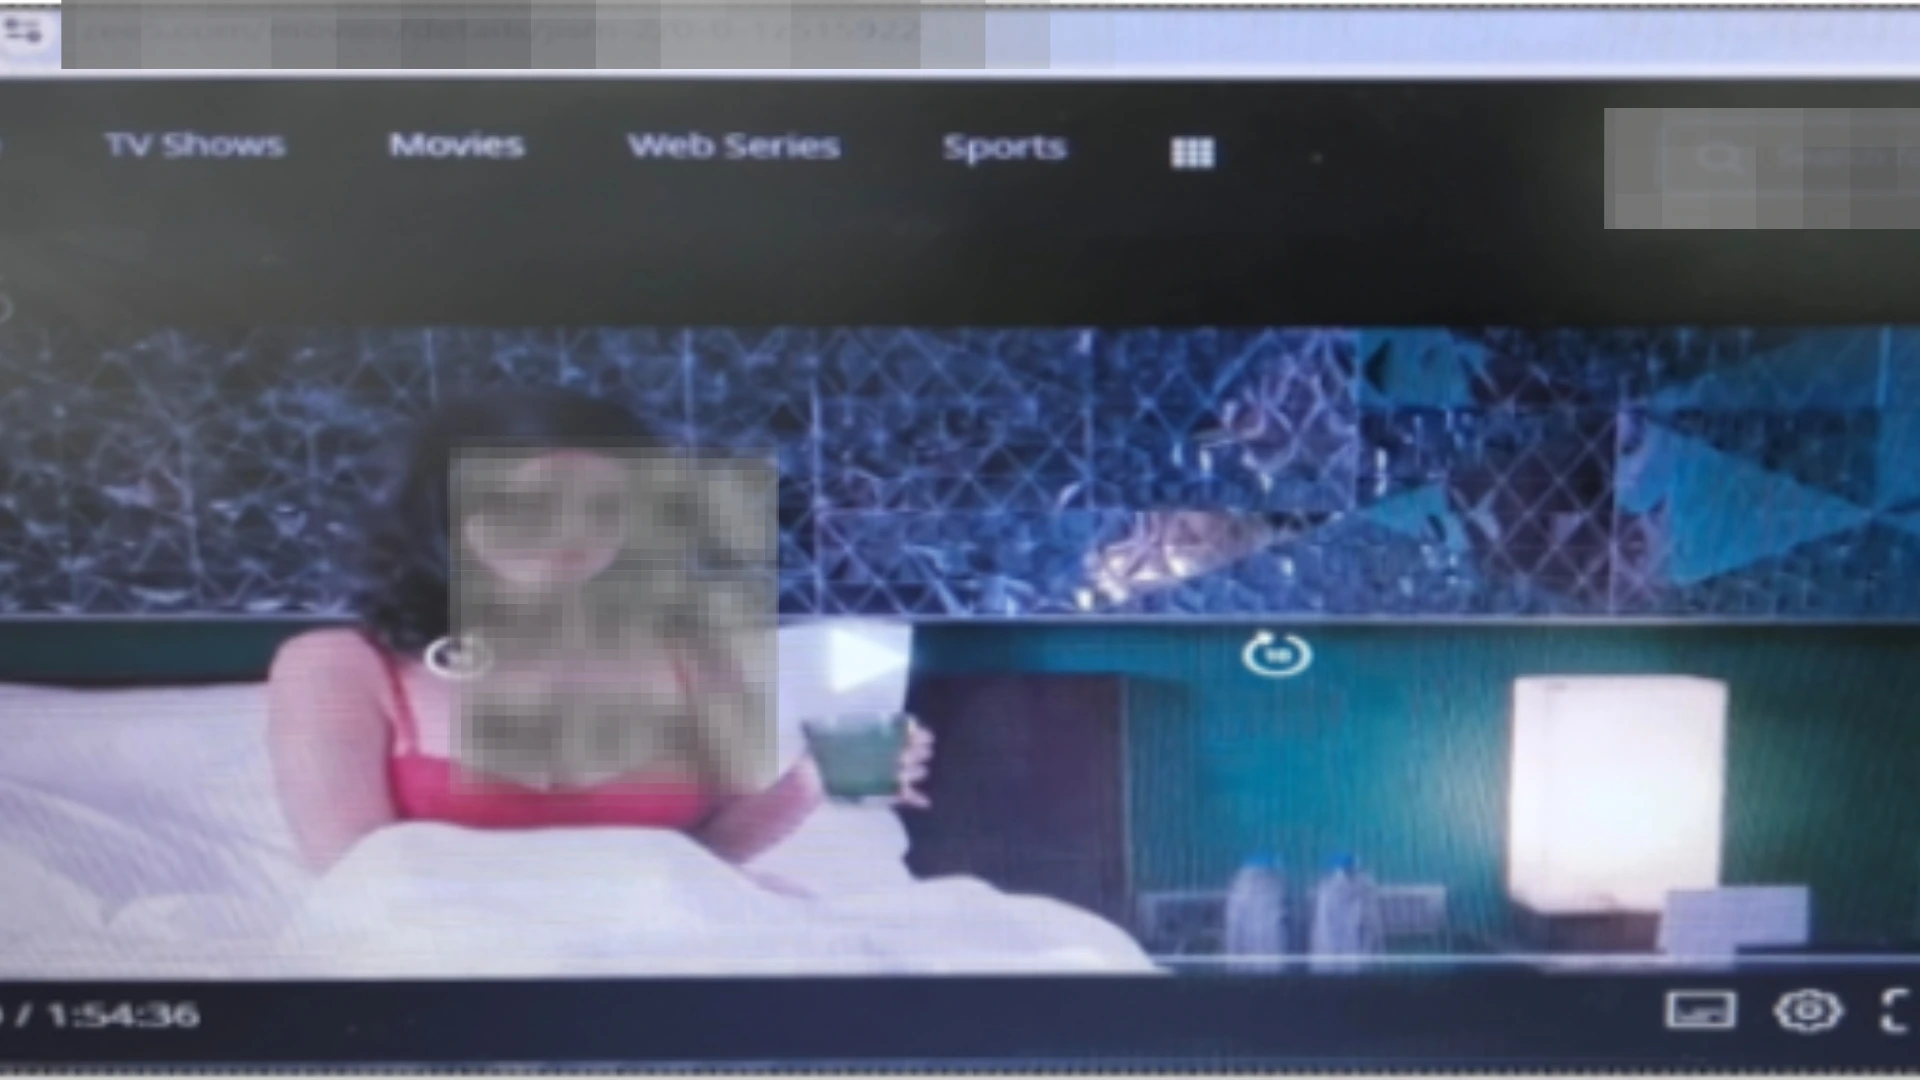
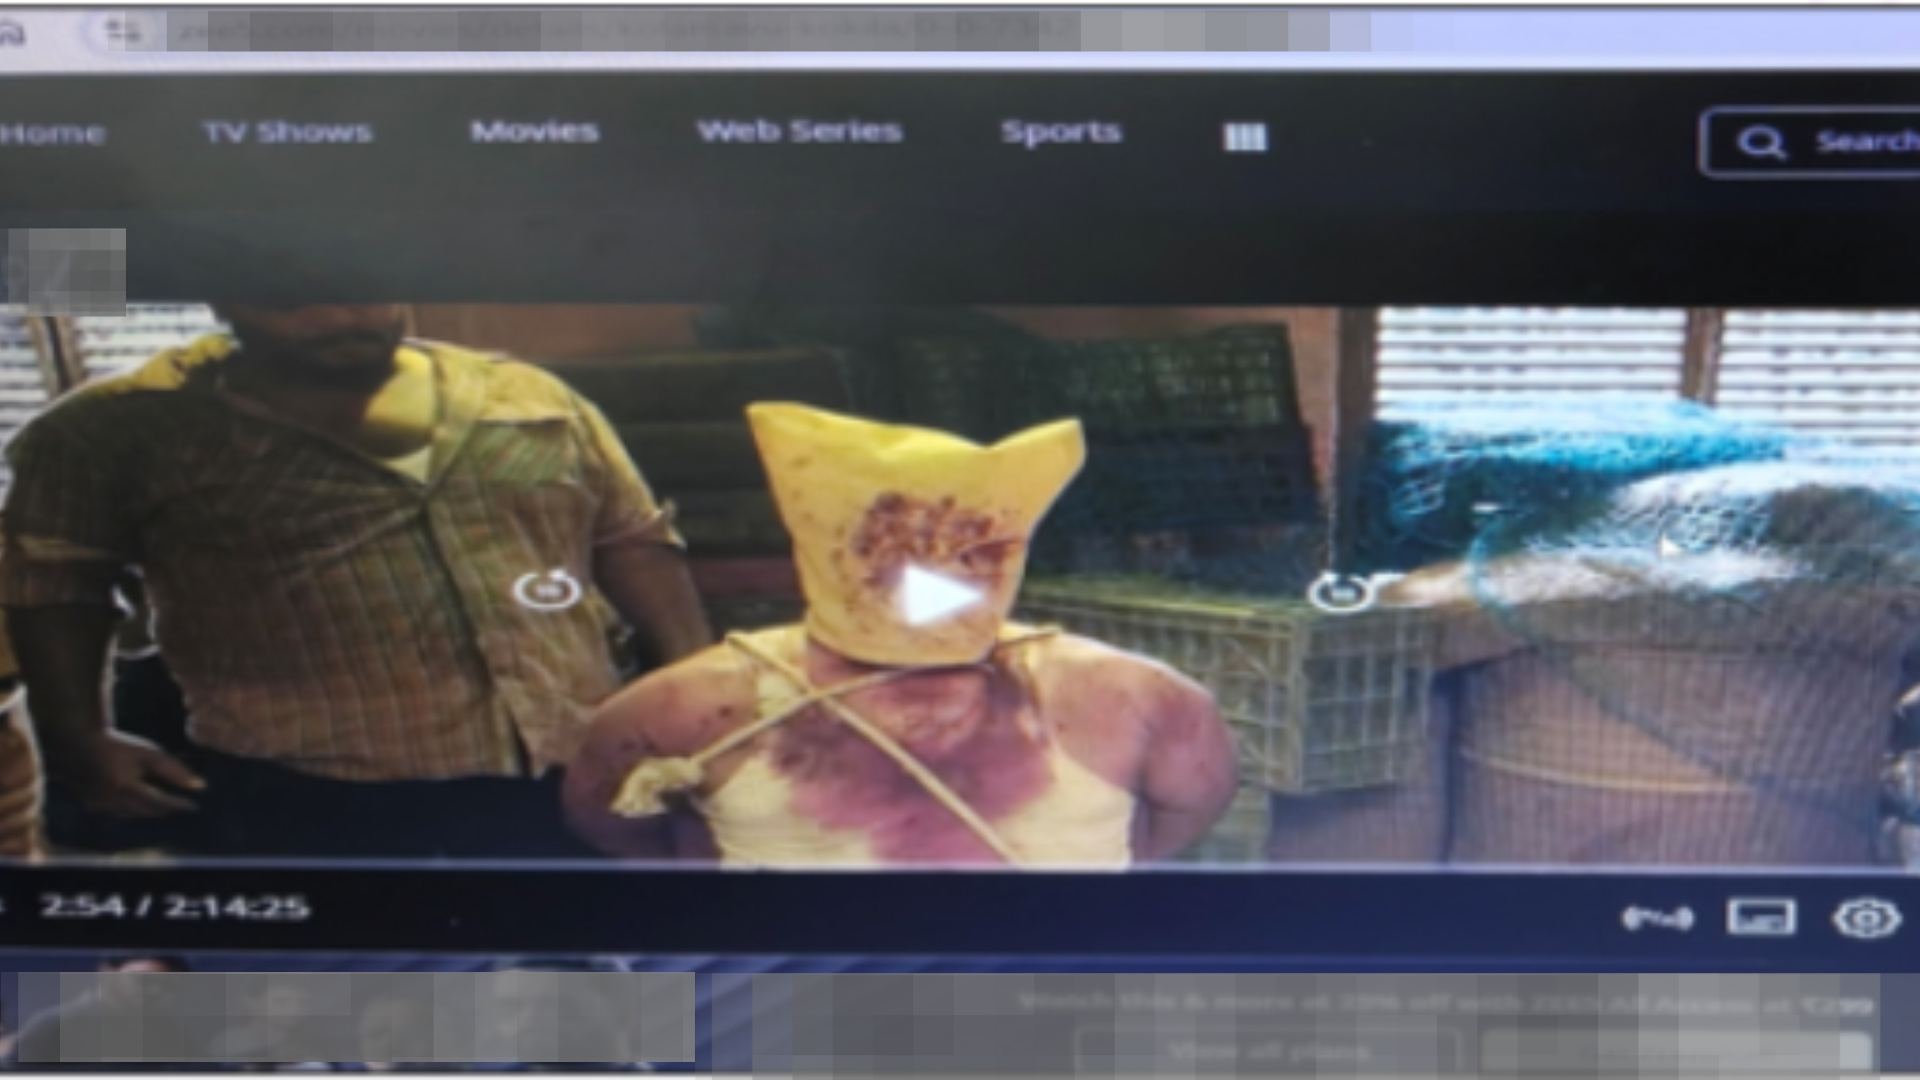
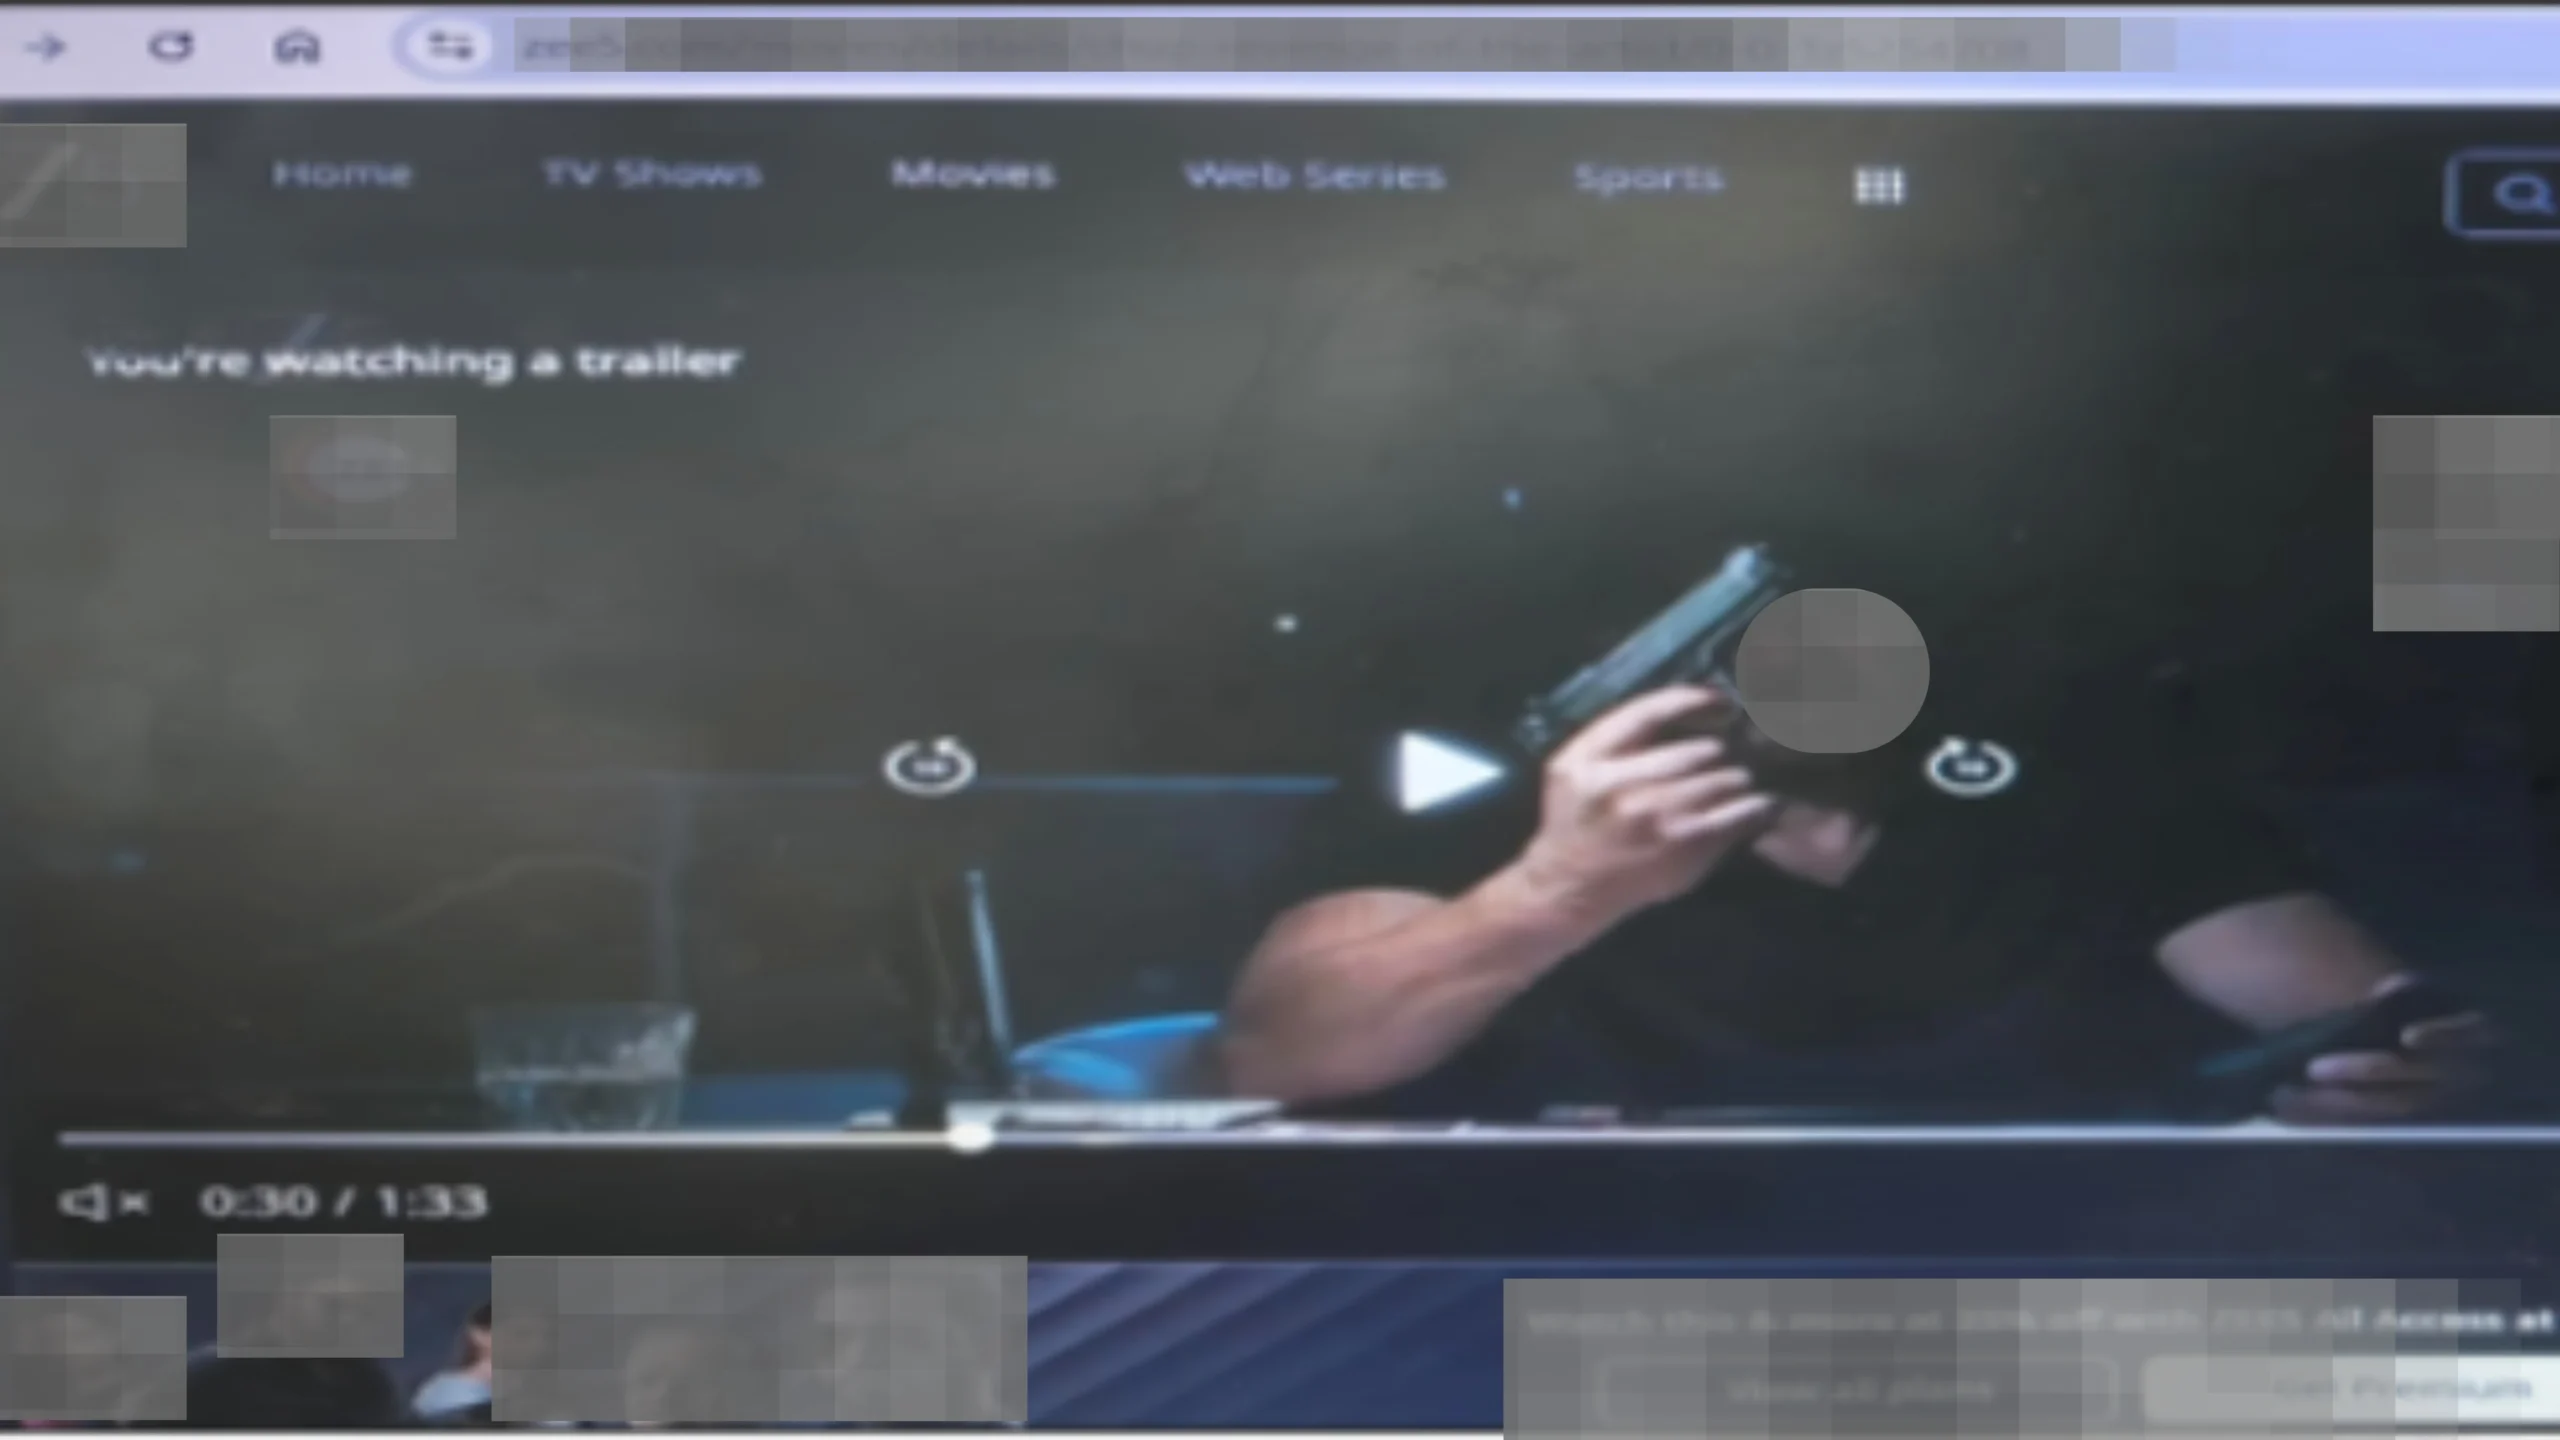
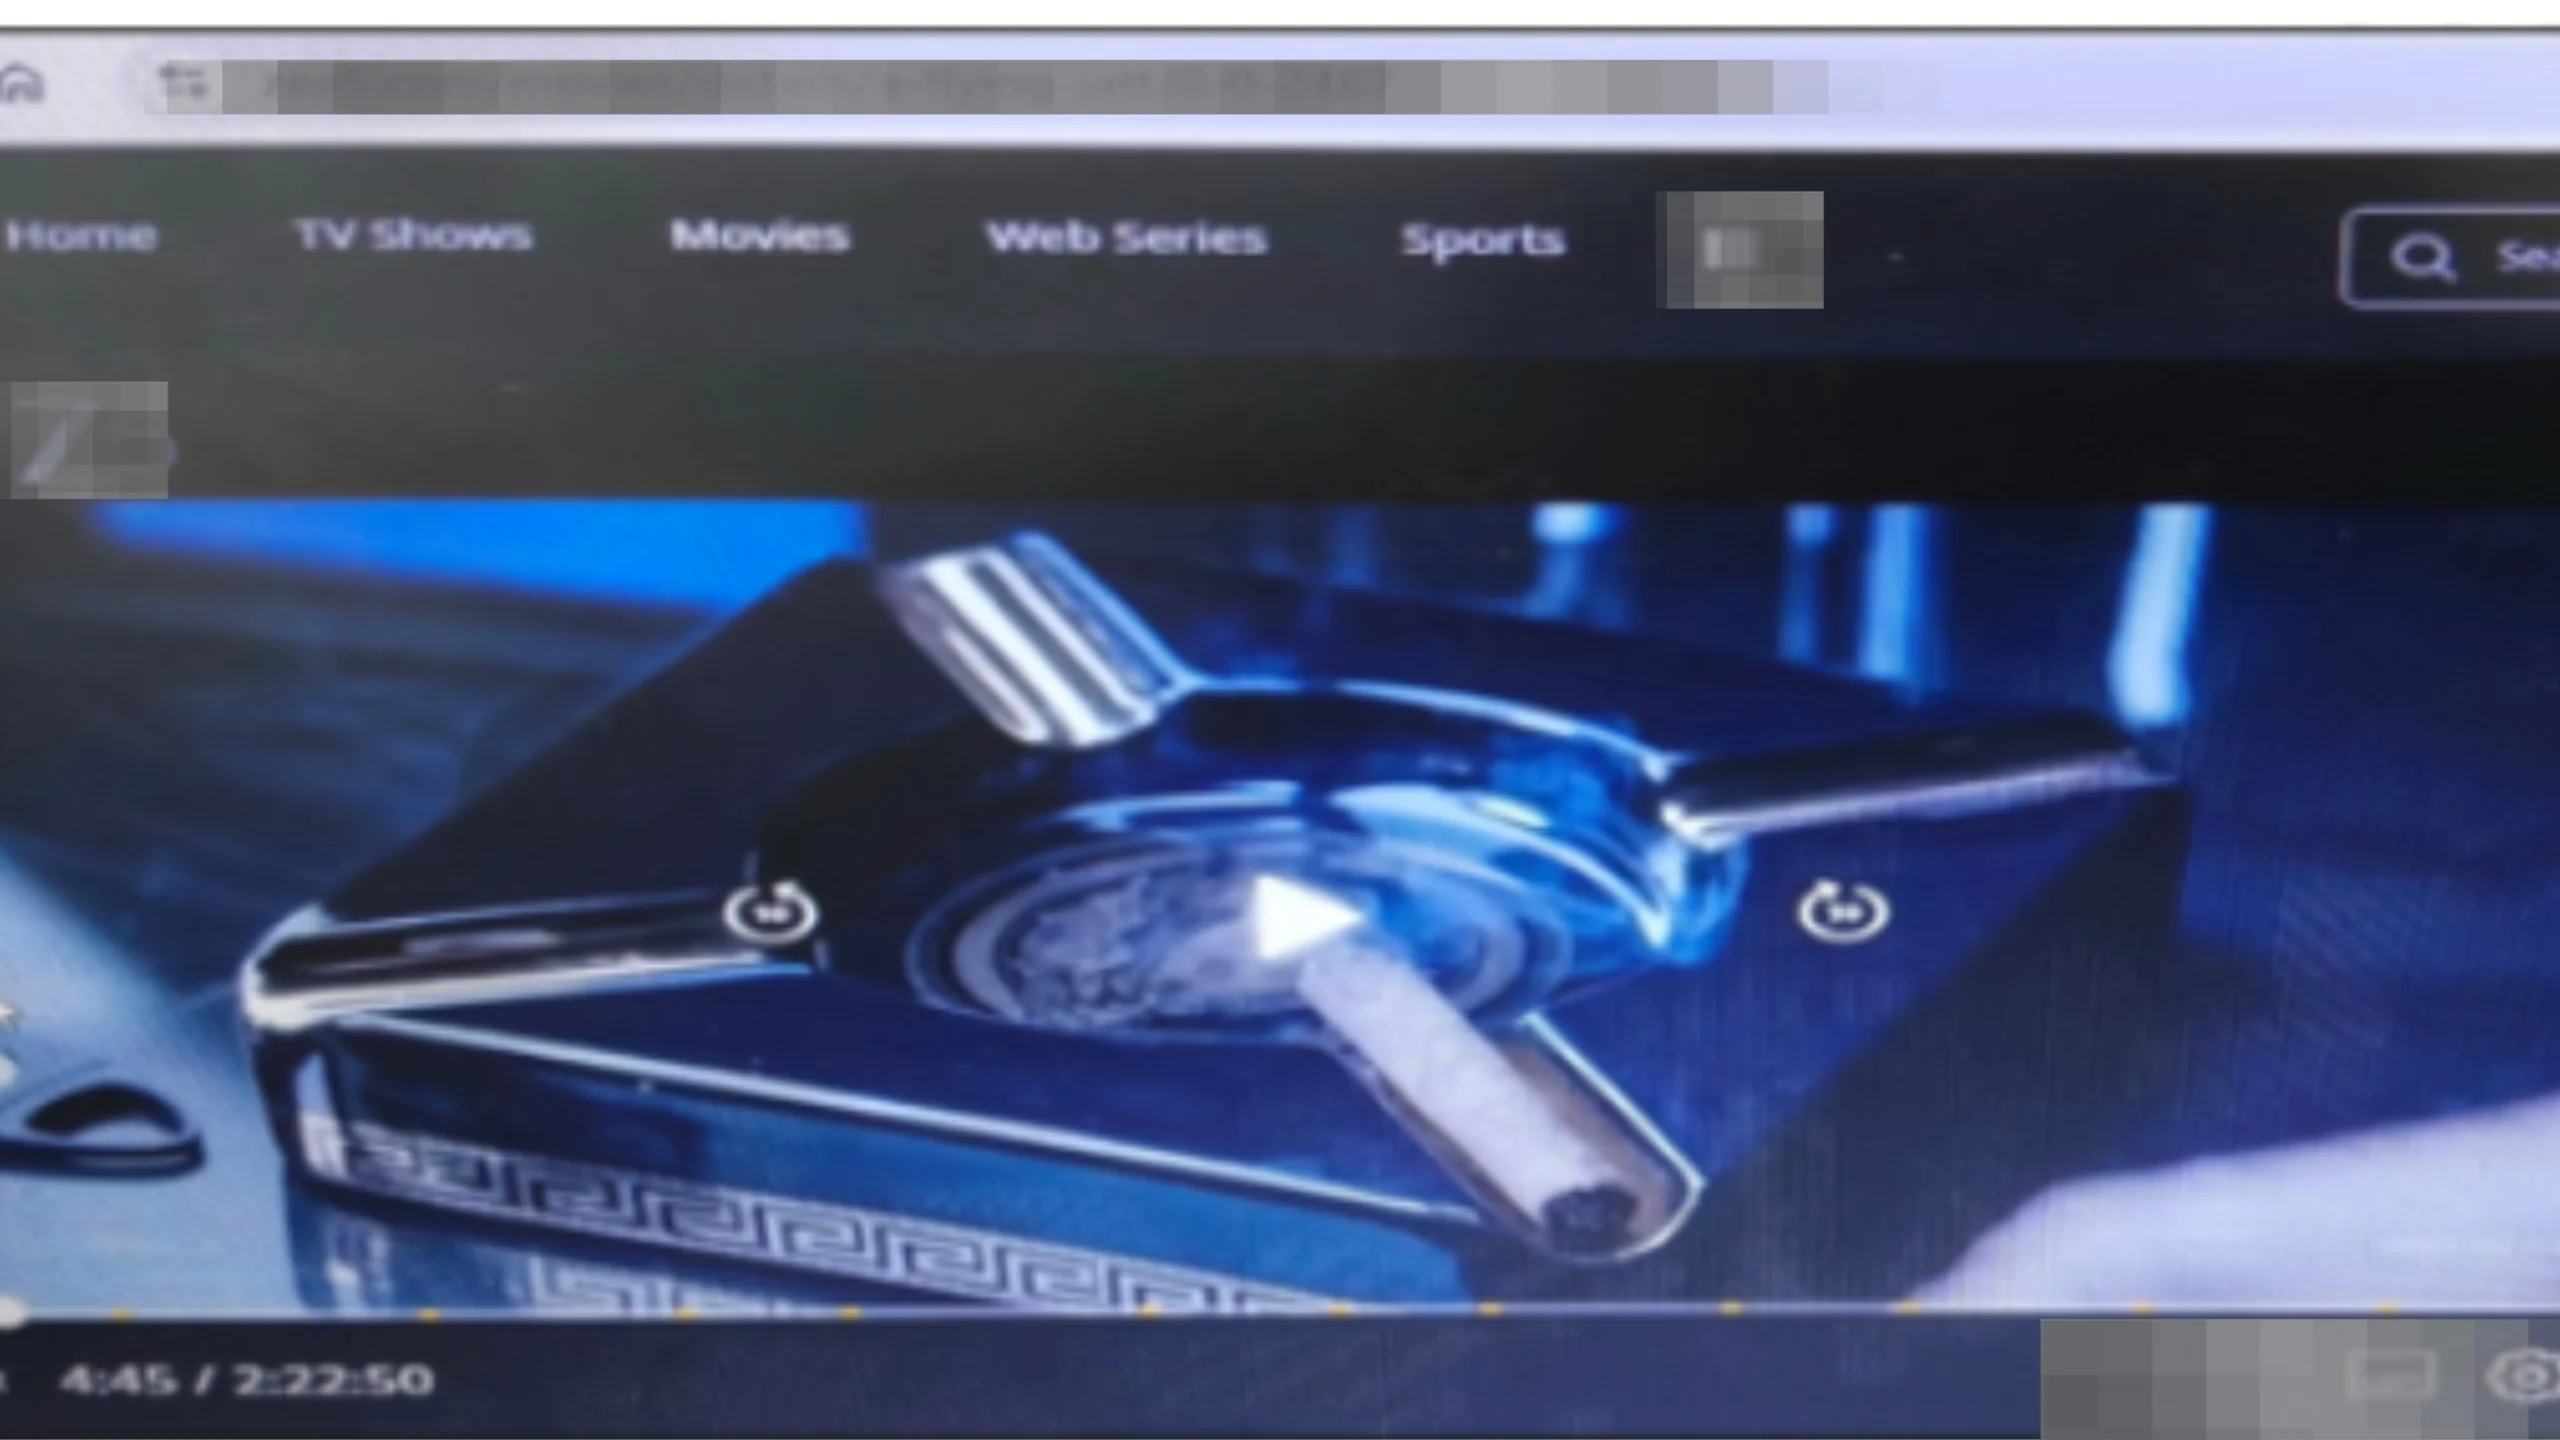
Specific placements were identified and blocked that fell into the brand unsafe content categories:
1. Obscenity & Profanity: Adult content classified under the GARM video safety framework
2. Crime & Harmful Acts: Films with depictions of violence and criminal activity
3. Arms & Ammunition: Content featuring weapons as a central theme
4. Illegal Drugs: Content involving drug-related imagery
These were not obscure placements on low-quality inventory. They were identifiable content URLs on mainstream OTT platforms, surfaced through systematic placement-level analysis.
Action Taken to Prevent Ad Placements Besides Unsafe Content
Each placement was analyzed based on text, frame-by-frame classification, and GARM-aligned video-level analysis. Once categorized as brand-unsafe, impressions associated with those placements were blocked from delivery. This ensured that the
Impact
- Brand ads appeared only against content that met its defined safety standards.
- No brand-unsafe impressions were counted as delivered.
- Brand’s media team received verifiable assurance, not just a platform-level declaration.
- Brand integrity was protected at the most granular level possible
Finding 3: Invalid Traffic – The Bots That Looked Like Genuine Viewers
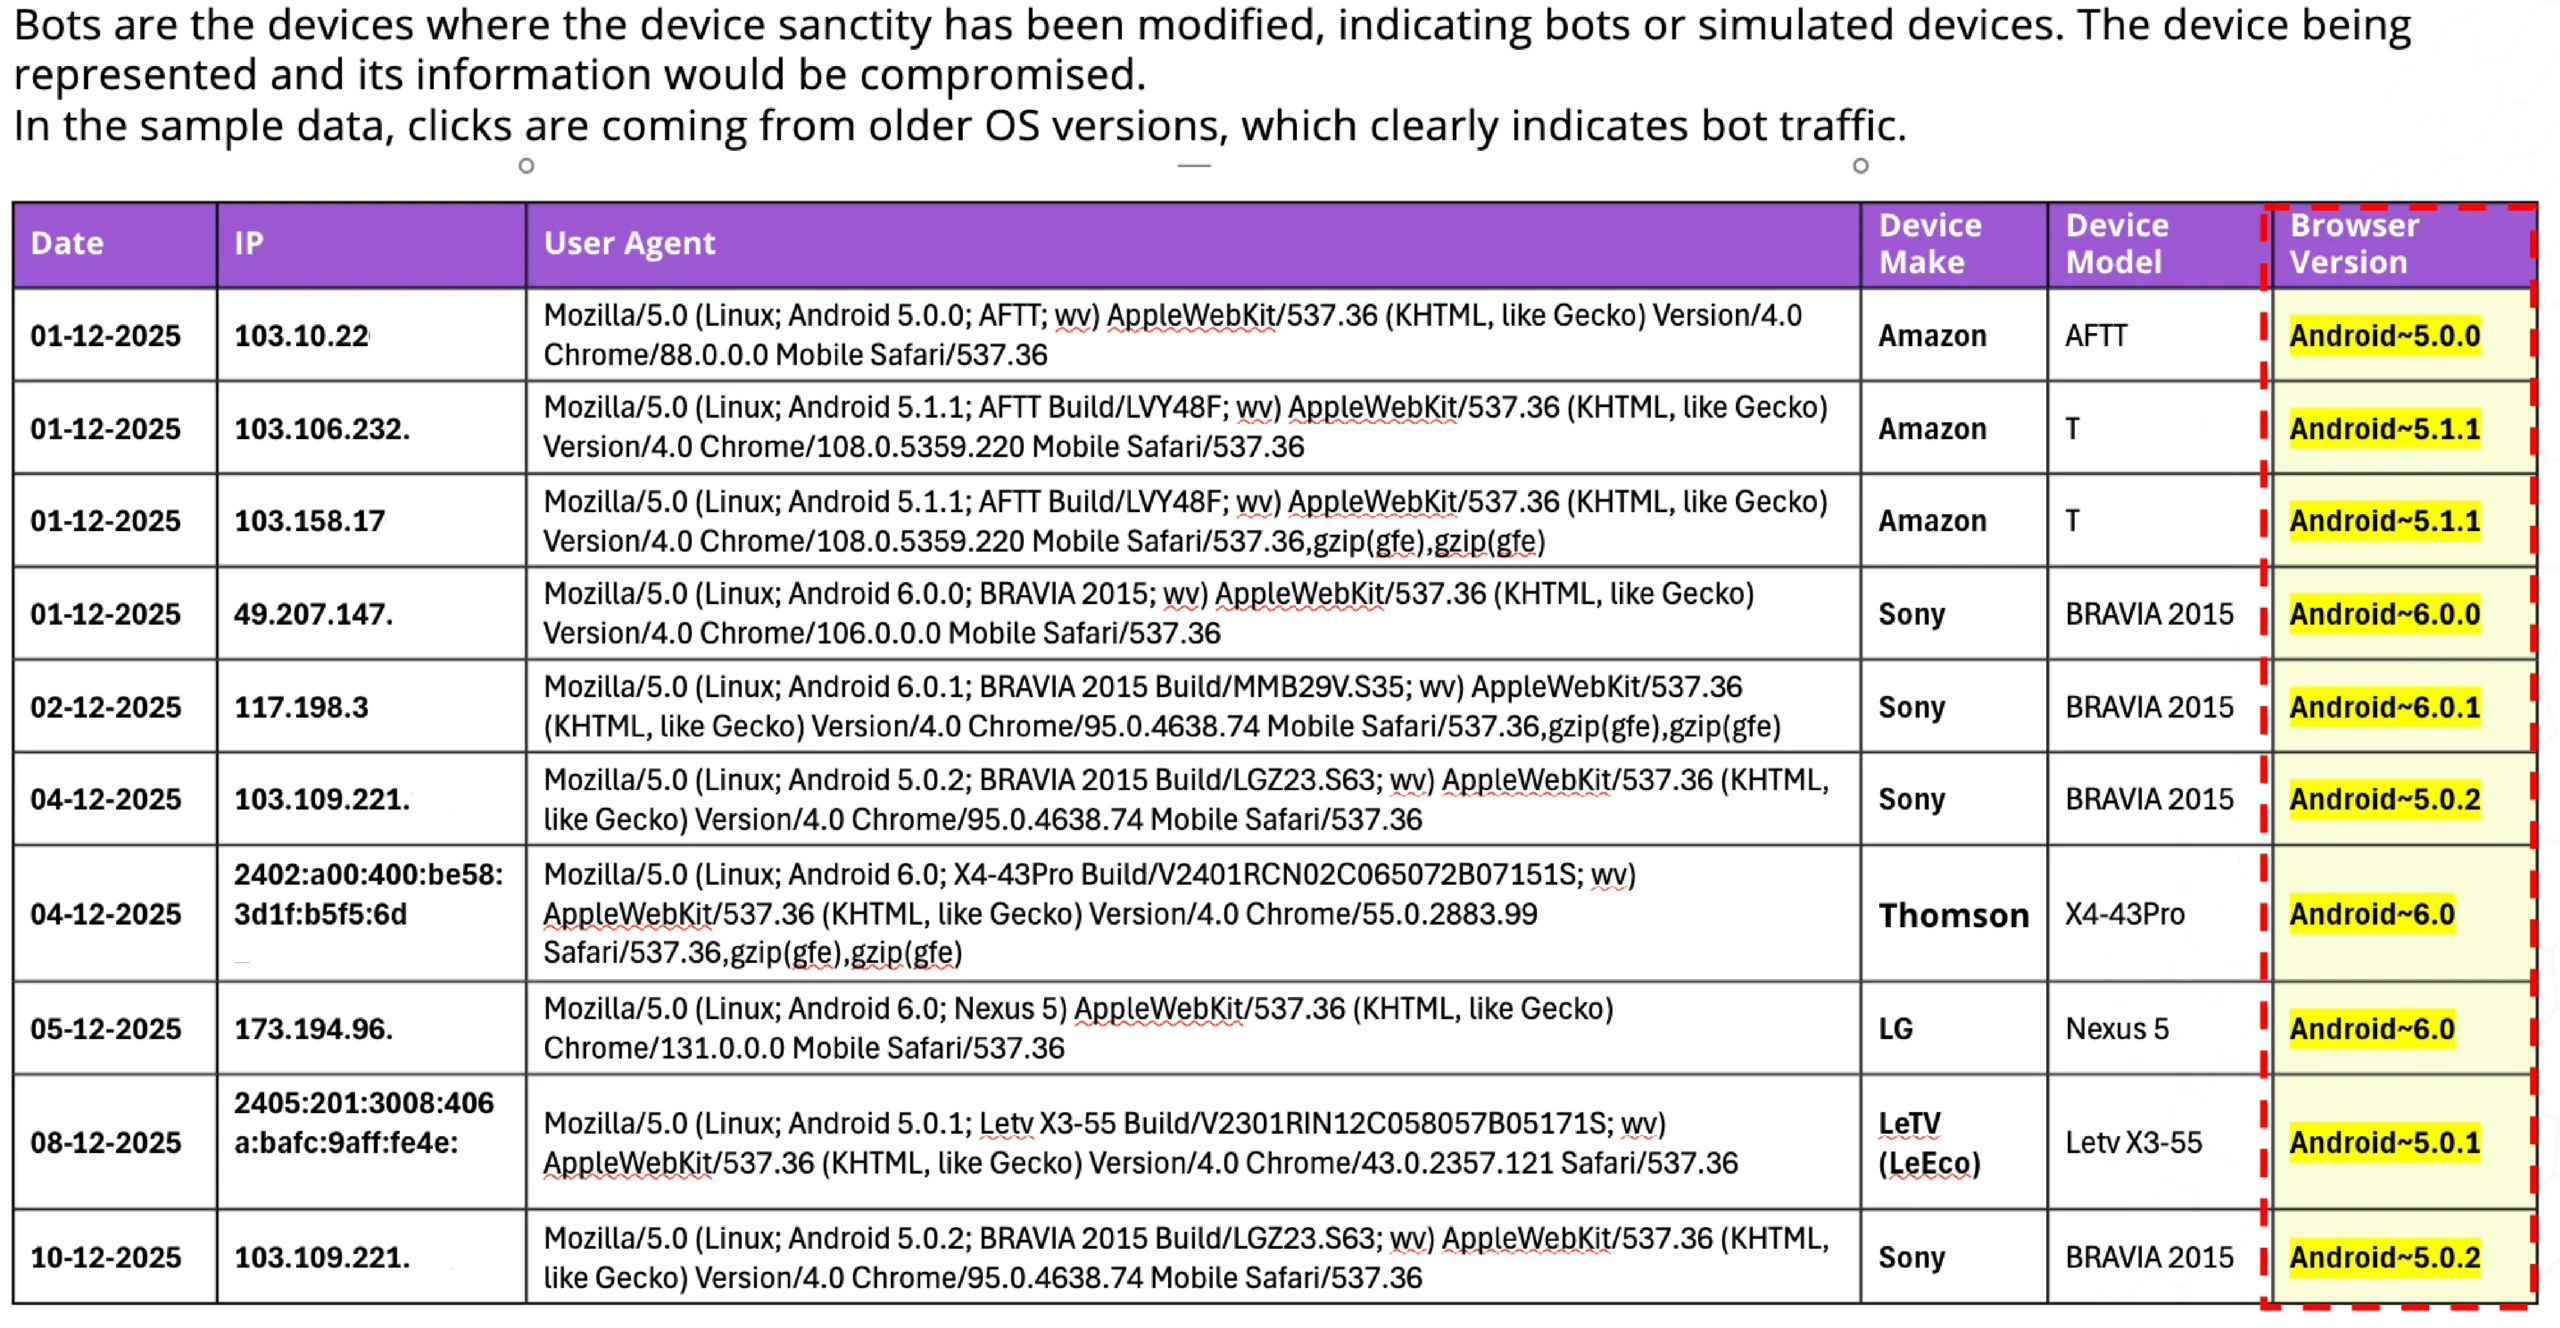
Invalid traffic on OTT does not look like a flood of suspicious clicks. In this campaign, it showed up in three distinct forms.
1. Outdated OS signals: Devices running Android versions 5.0, 5.1, and 6.0 were generating ad requests in December 2025. These are operating system versions that are years past their support lifecycle.
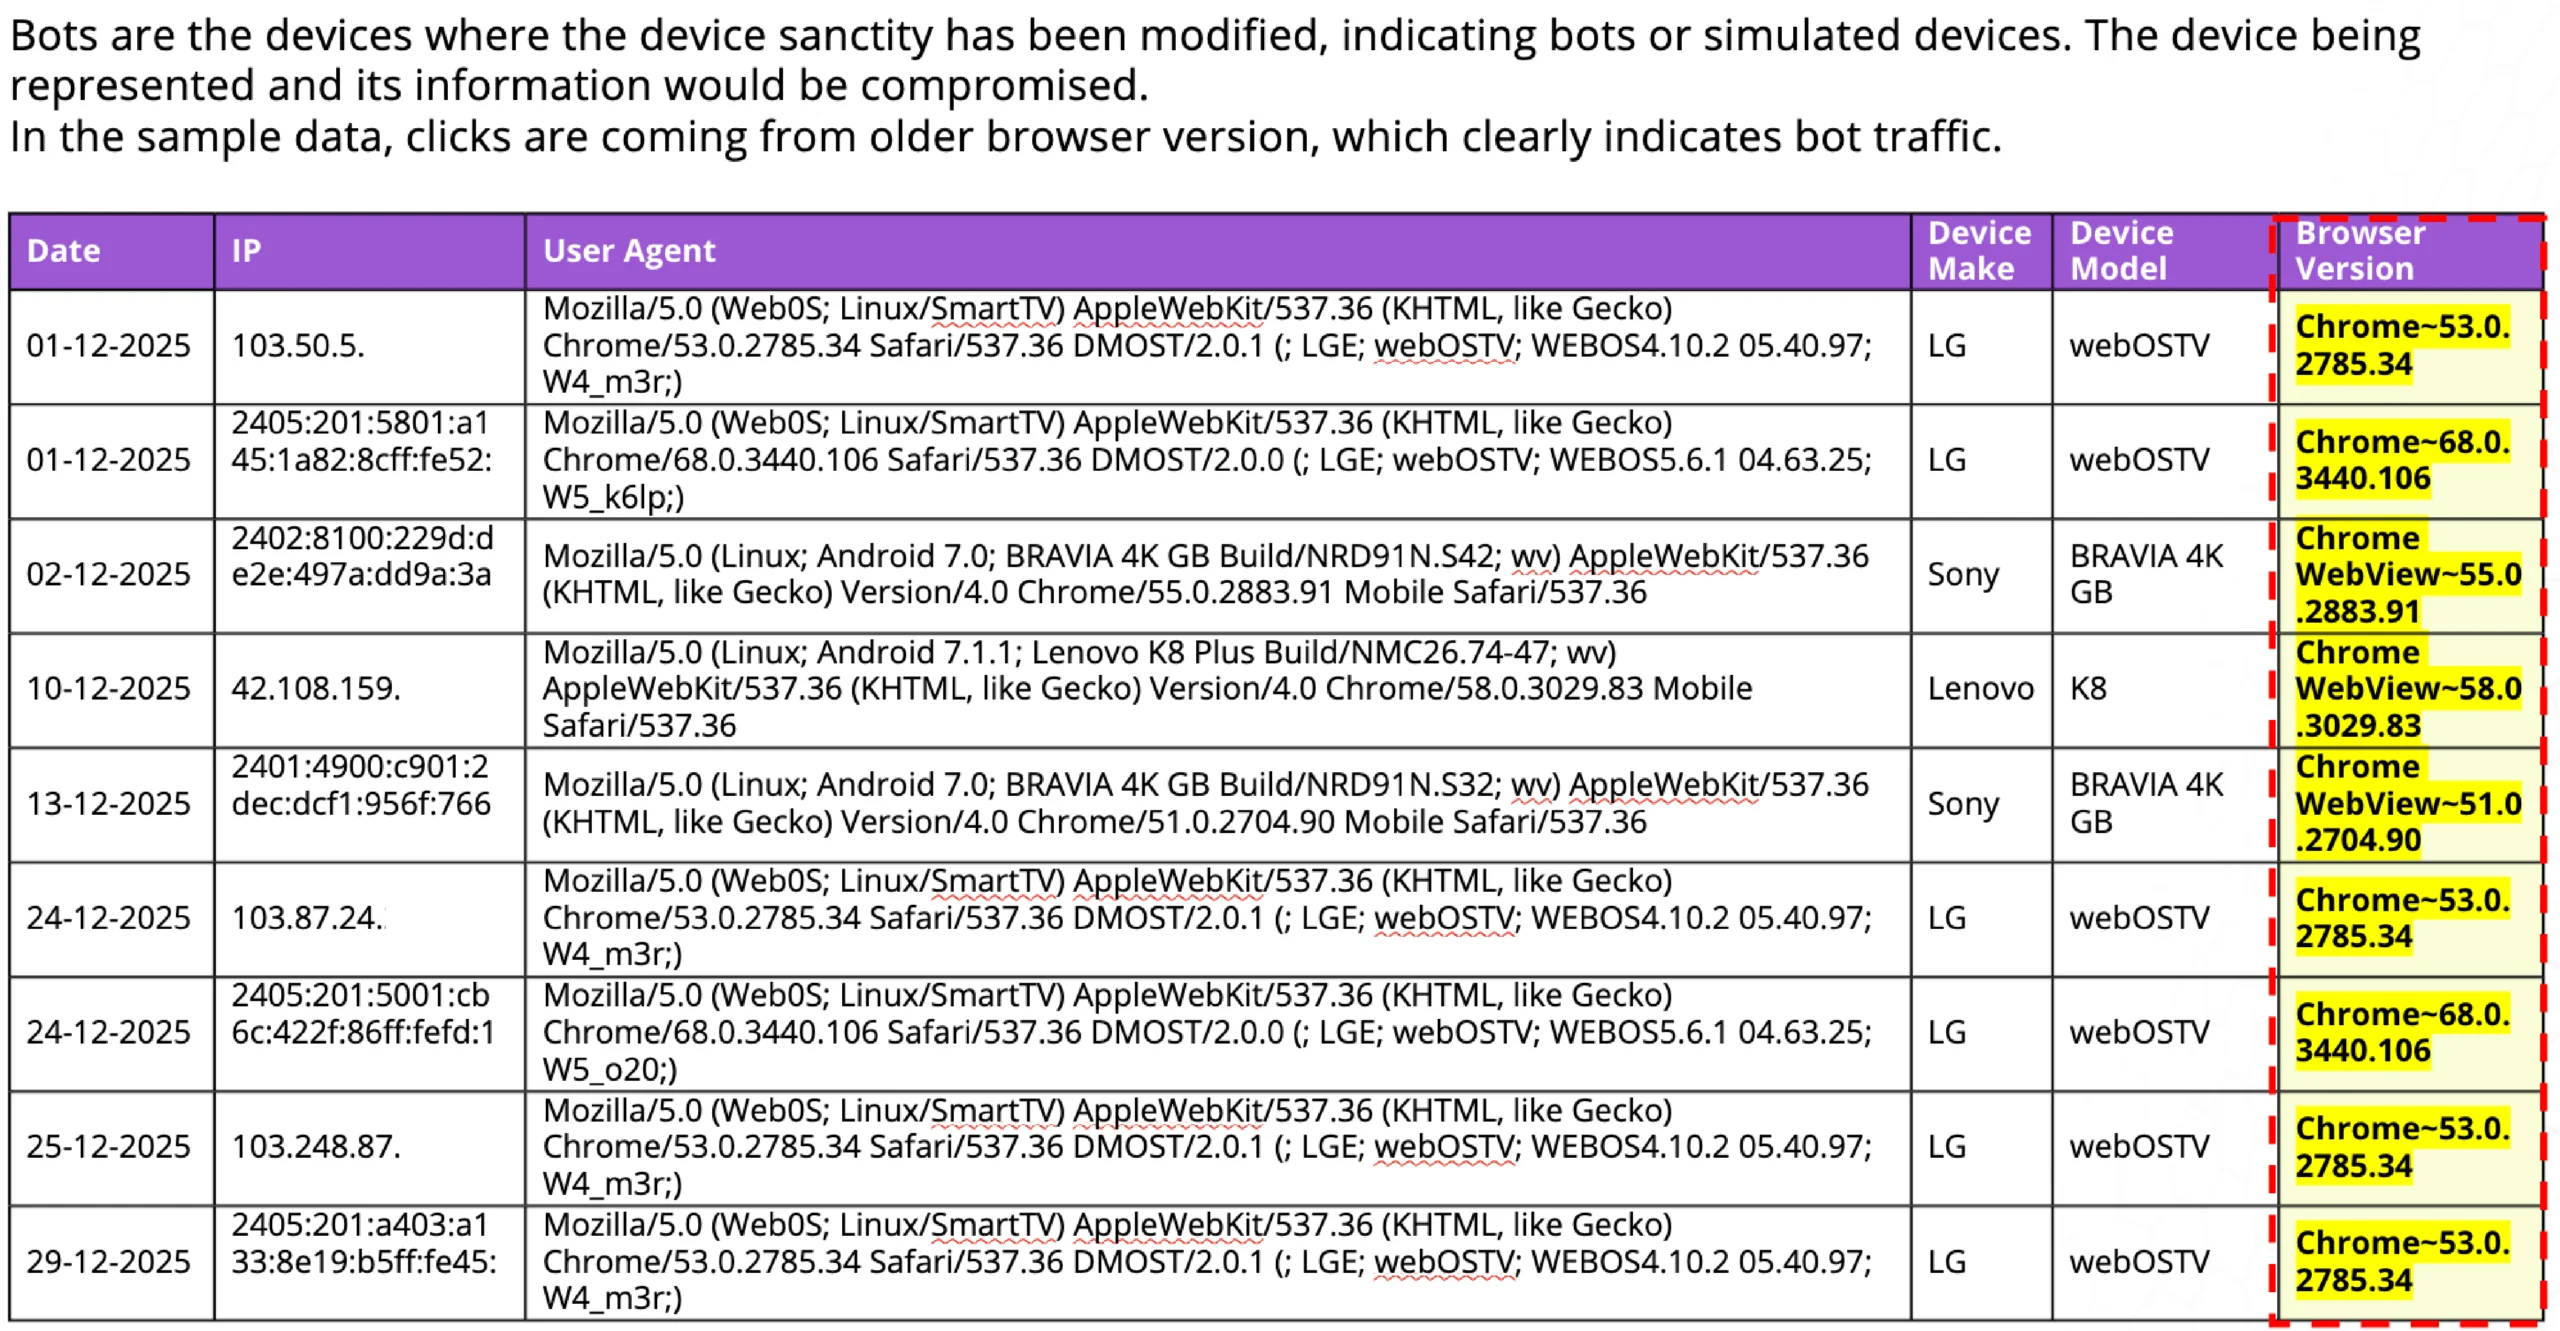
2. Outdated browser signals: Smart TV devices were detected running browser versions from nearly a decade ago, like Chrome 53 and Chrome 68. In-use CTV devices do not carry browser fingerprints this outdated. These signals point clearly to spoofed or manipulated device identities.
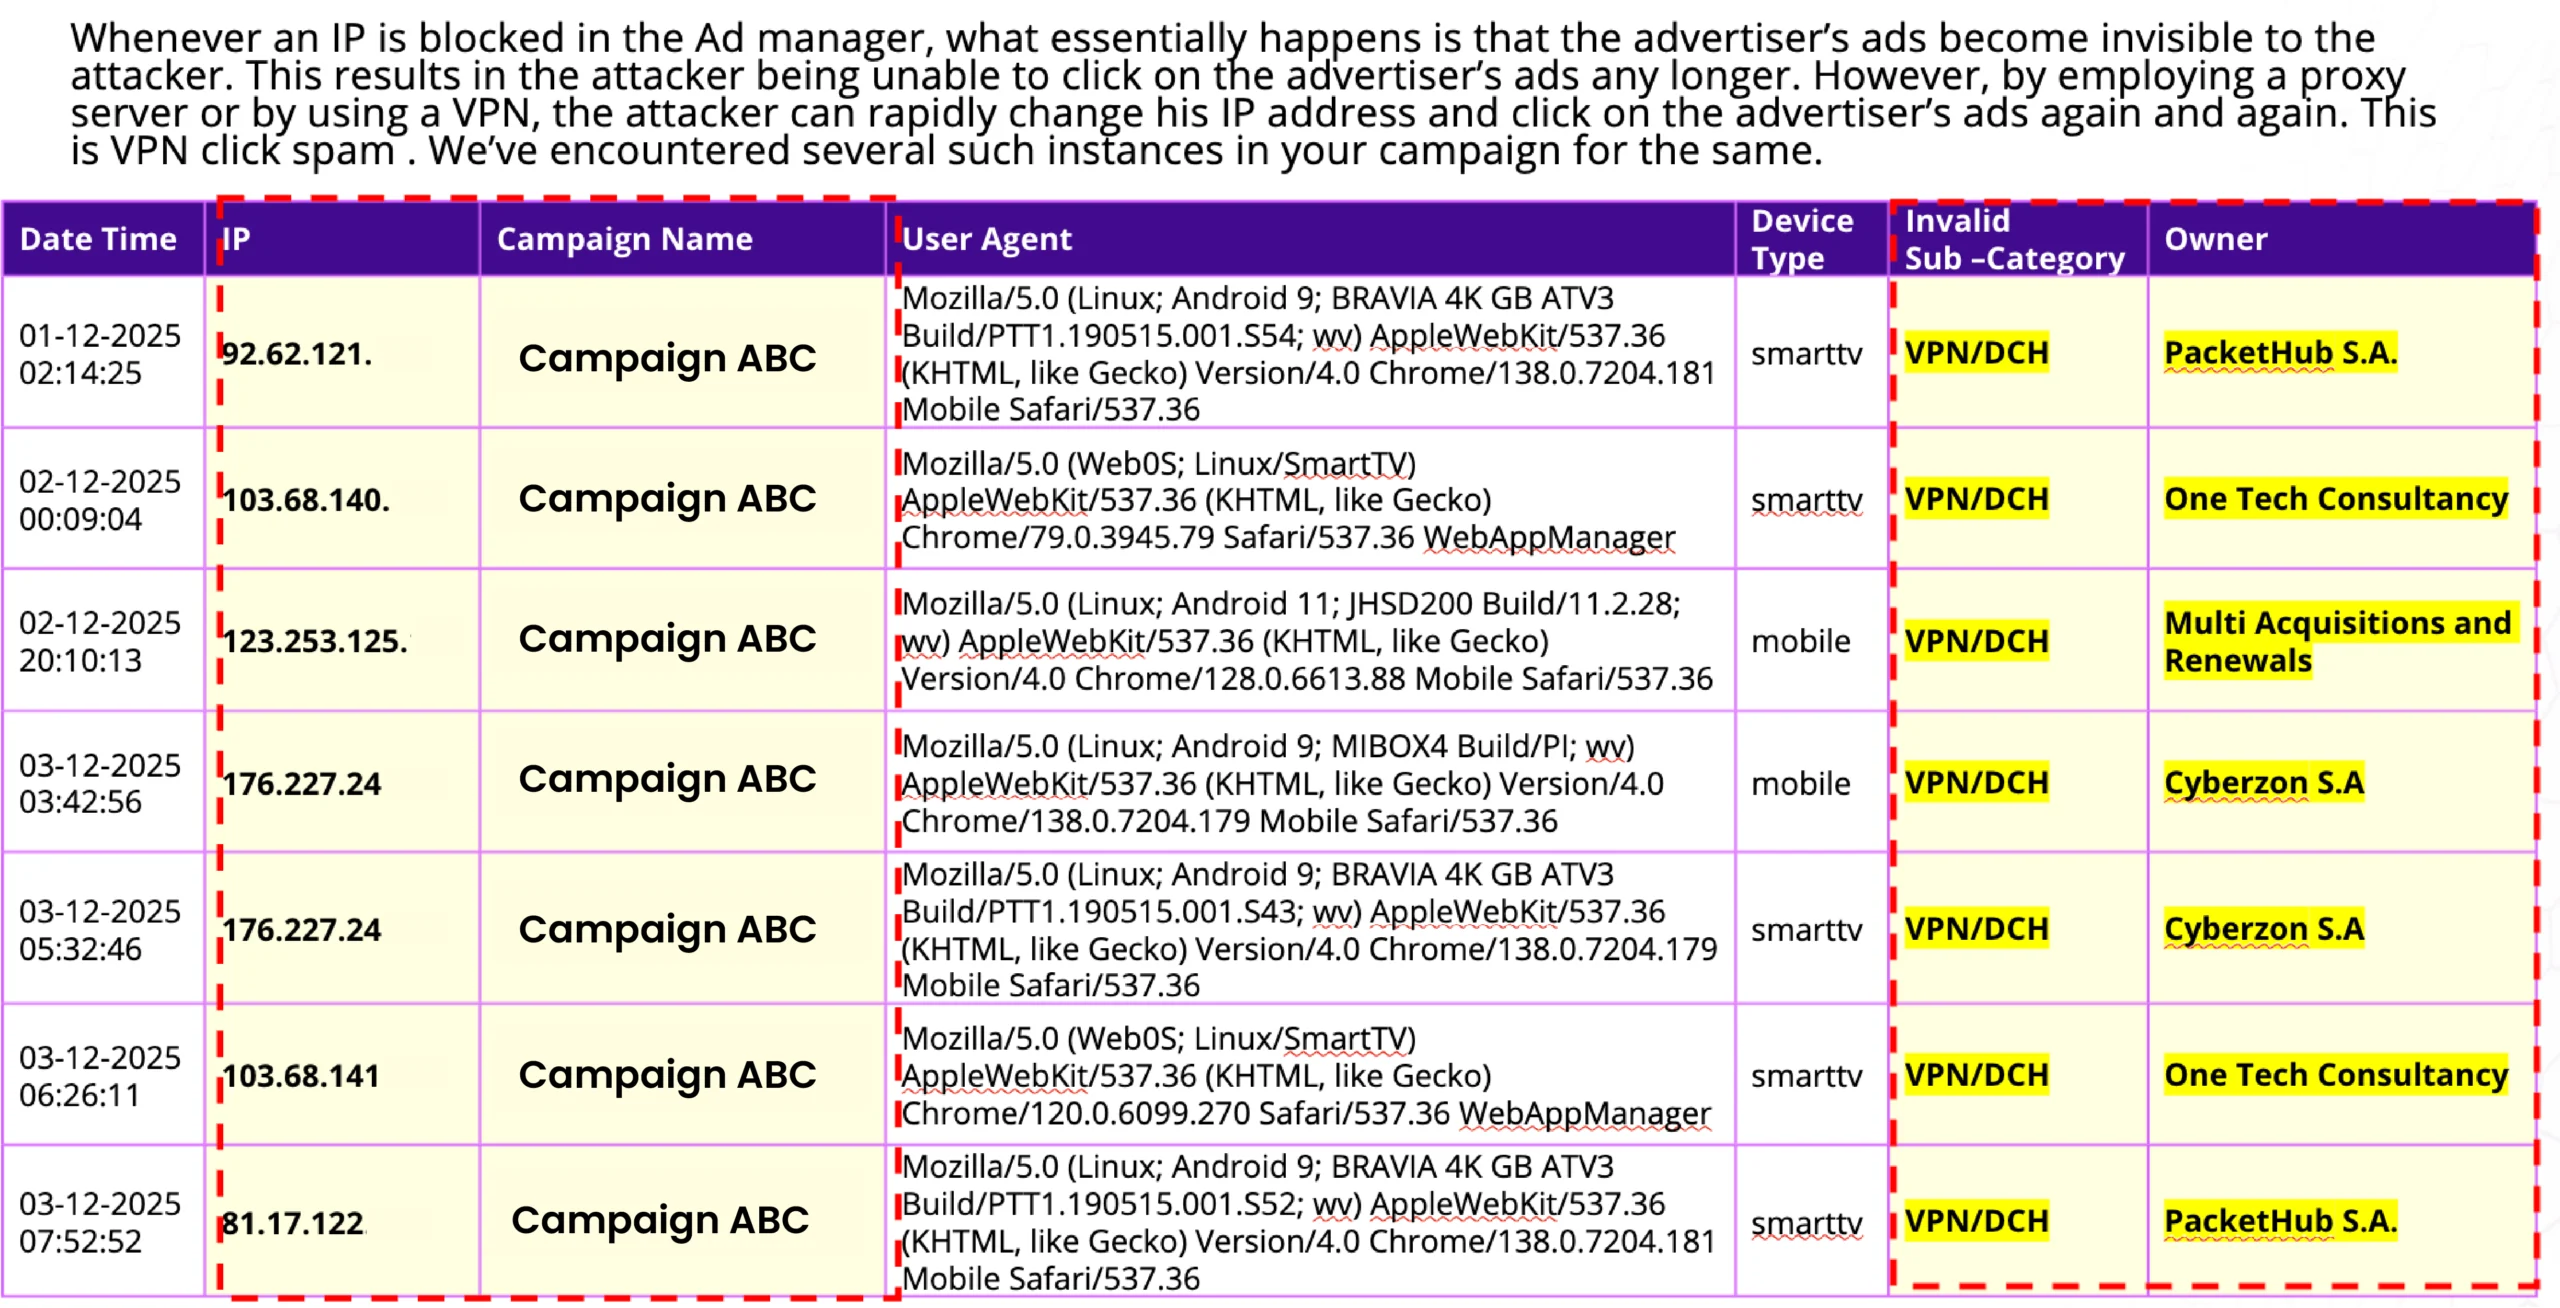
3. Data Center IP activity: A subset of traffic was traced to IP addresses belonging to data centers and VPN infrastructure providers. These IPs were routing traffic to mimic genuine viewer behavior, appearing to originate from real residential locations while actually passing through commercial data center networks.
Action Taken to Reduce Bot Traffic
Each signal was evaluated in real time as part of the VAST-level ad traffic validation process. Requests carrying bot traffic indicators were flagged and blocked before an impression was served.
Impact
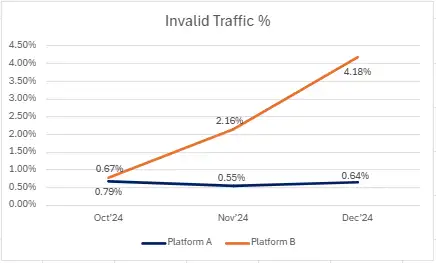
- On Platform A, invalid traffic stayed between 0.55% and 0.67% across the quarter.
- On Platform B, despite higher inventory variability, IVT was actively contained through continuous real-time filtering.
- Zero IVT-affected impressions were passed through as billable delivery across either platform, every impression that was counted was a genuine one.
As a result, once all three layers of validation were in place, the campaign delivered exactly what it was planned to. Viewability held above 92% throughout the quarter. Geographic delivery aligned closely with targeting intent; regional campaigns delivered impressions in their intended language markets. Moreover, CTV advertising accounted for nearly 99.9% of delivery across both platforms, confirming the campaign was genuinely reaching the living room screen it was built for.
Why is Ad Traffic Validation Non-Negotiable for OTT & CTV Campaigns?
Frequency violations, unsafe placements, sophisticated invalid traffic – these patterns exist across OTT campaigns broadly. They go undetected simply because advertisers often don’t look at the right layer of data. Here’s what mFilterIt’s proactive ad traffic validation solution – Valid8 makes possible for brands:
Ensures your frequency cap is actually working, not just set
Enforces frequency cap thresholds at the device level, so before the impression is served, overexposure is stopped before it costs you, not flagged after the budget is spent.
Protects your brand from appearing in the wrong context or sentiment
Platform-level brand safety labels don’t tell you what specific content your ad ran against. Our ad traffic validation solution’s content and placement-level analysis maps every impression to its actual video classification, ensuring your brand ads only appear in contexts that align with your values.
Keeps media investment directed toward real audiences
Invalid traffic on CTV looks like delivery on a standard dashboard. Device-level and IP-level validation separates genuine viewers from bots before the impression is served, so every counted impression is one that can be trusted.
Turns campaign data into something you can actually rely on
When frequency, brand safety, and traffic quality are all validated before impressions are counted, your campaign report reflects reality, not an approximation of it.
Conclusion
OTT delivers premium audiences, but premium inventory is not the same as clean delivery. The gap between the two is where budgets leak.
With the right ad fraud detection in place, every impression you count is one you can stand behind.
Ready to see what your OTT campaign data is really telling you?
Get in touch with our experts now.
FAQs
How does frequency capping breaches affect OTT ad campaigns?
Frequency capping breaches lead to overexposure, causing user fatigue, higher churn, and wasted ad spend. In OTT campaigns, it also skews reach metrics, inflates impressions, and reduces campaign effectiveness by repeatedly targeting the same users instead of expanding unique audience reach.
What are the common types of fraud in OTT advertising?
Common OTT ad fraud types include device spoofing, ad stacking, invalid traffic (IVT), and bot-driven impressions. These tactics generate fake views, misleading advertisers about actual campaign performance.
How can brands ensure safety in OTT advertising environments?
Brands can ensure OTT safety through pre-bid and post-bid verification, strict inventory whitelisting, frequency controls, and continuous monitoring. Using advanced ad fraud detection and brand safety solutions helps identify invalid traffic, ensure content suitability, and maintain transparency across OTT platforms.
How does invalid traffic (IVT) impact OTT ad performance?
Invalid traffic generates fake impressions and engagements, leading to wasted ad budgets and inaccurate performance metrics. It distorts campaign insights, making optimization and ROI measurement less reliable.
How can real-time monitoring improve OTT ad fraud detection?
Real-time monitoring helps identify suspicious patterns instantly, enabling quick action against fraudulent activity. It improves transparency, reduces financial losses, and ensures campaigns reach genuine audiences effectively.