
Every brand’s marketing program runs on one principle – more visits amount to more leads. While Google and META highly influence users’ journey but not all that stands true. The journey is simple but equally prone to the complexities of digital advertising ecosystem. This shifts the real question from how many visits your campaigns generate to where those visits are coming from or if they are leading to any conversions?
We saw this firsthand while working with one of the USA’s leading aggregator players. For them, deeper validation of their campaign traffic was the turning point. When they looked closer at where their visits were actually coming from, the picture changed entirely. Irrelevant, low-quality sources were quietly eating into their budget and polluting their campaign data, making it nearly impossible to measure what was truly working.
So, they made a call: blacklist the bad sources. Clean the data. And rebuild on a foundation they could actually trust.
In this blog, we break down exactly how that played out:
- Sources that pollute Google and Meta campaigns and their impact
- How blacklisting changed the game
- The measurable impact of defending against fraudulent traffic
- Key takeaways for marketers
- Conclusion
Source-Level Fraud in Google and META Campaigns
We did a thorough analysis of the brand’s campaigns running on Google and META and here’s what we found –
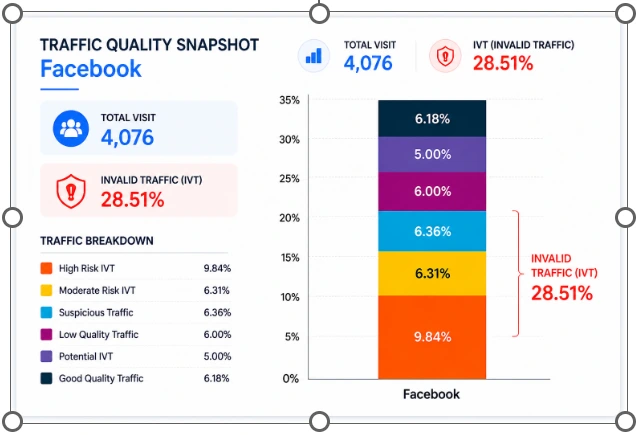
From META, brand received the highest Invalid Traffic (IVT) of 28.51%.
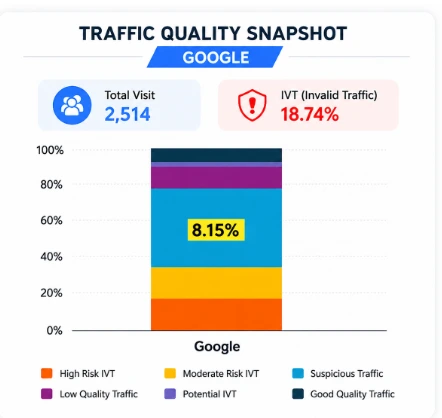
From Google, brand got 8.15% IVT from various fraudulent sources.
The difference in invalid traffic across platforms clearly shows that not every traffic source delivers the same quality of users. A campaign may generate high traffic numbers, but that does not always mean the visits are genuine or valuable. In some cases, a large portion of traffic can come from fraudulent or low-quality sources that never convert into real customers.
For Google campaigns, the IVT percentage may appear lower compared to other platforms, but the advertising costs on these walled gardens are significantly higher. This means that even a small percentage of invalid traffic can result in substantial budget wastage and reduced campaign efficiency.
To understand this better, let’s look at the major sources contributing to IVT and the direct impact they have on marketing campaigns –
- VPN/ Proxy Fraud: Traffic routed through VPNs or proxy networks to disguise real user identity and location.
Impact: Bypasses geo-targeting and fraud filters, making fake traffic appear legitimate. - Geo Fraud: Traffic coming from the geographies that were never a target at the first place.
Impact: Creates a false sense of campaign success in priority markets. - Behavior Fraud: Bots or automated scripts designed to mimic real user actions like fake clicks, scrolling, session duration.
Impact: Inflates engagement metrics while delivering zero real intent. - Device Repetition: Repeated interactions from the same device or a controlled pool of devices also called device farms.
Impact: Indicates click farms or emulator-driven traffic, skewing user-level data. - Pop-Under Traffic: Ads triggered in hidden or background windows without active user intent. Impact: Generates low-quality visits that look like traffic but don’t convert meaningfully.
mFilterIt’s Solution: How Blacklisting Changed the Game for Leading Aggregator
mFilterIt transformed campaign performance by shifting the focus from traffic volume to traffic authenticity. Through our ad fraud detection tool, brands attained real-time traffic validation and source-level analysis, identifying and blocking fraudulent or low-quality sources before they impact campaign outcomes.
This enables brands to take precise actions like blacklisting, ensuring that only genuine users move through the funnel. Here’s how it changed the game –
IVT Dropped by 42% in META Campaigns
What began at 38% dropped down to 22% in just three months, a major 42% reduction in IVT.
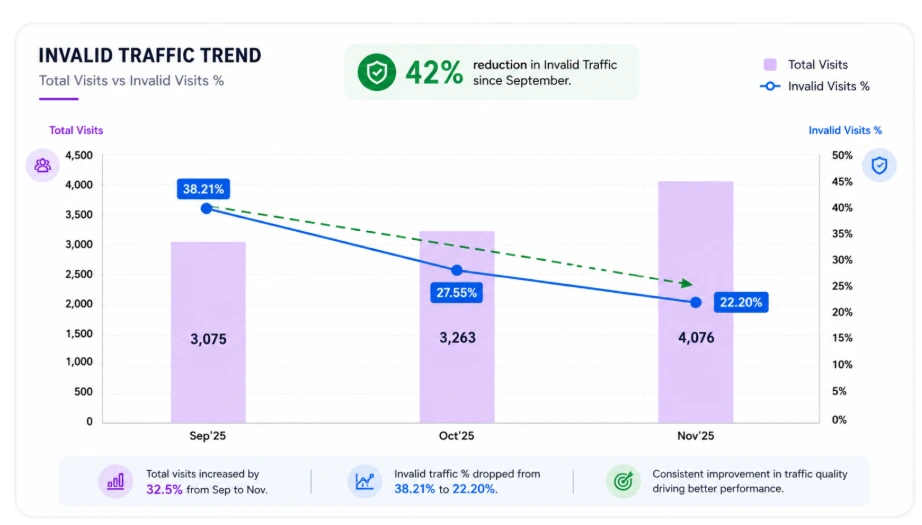
This was not a one-time correction; it indicates a consistent, ongoing improvement driven by focused campaign optimization.
As deeper traffic validation was done and low-quality sources were identified, the system was able to filter out fraudulent sources such as geo-masking and repeated device activity. Over time, this led to cleaner inputs, better targeting decisions, and more reliable performance signals.
The continuous decline also indicates that optimization efforts didn’t just remove existing fraud but actively prevented its recurrence.
IVT Dropped by 8.4% in Google Performance Max Campaign
Below graph highlights reduction of IVT in Google performance max campaigns by 8.4%.
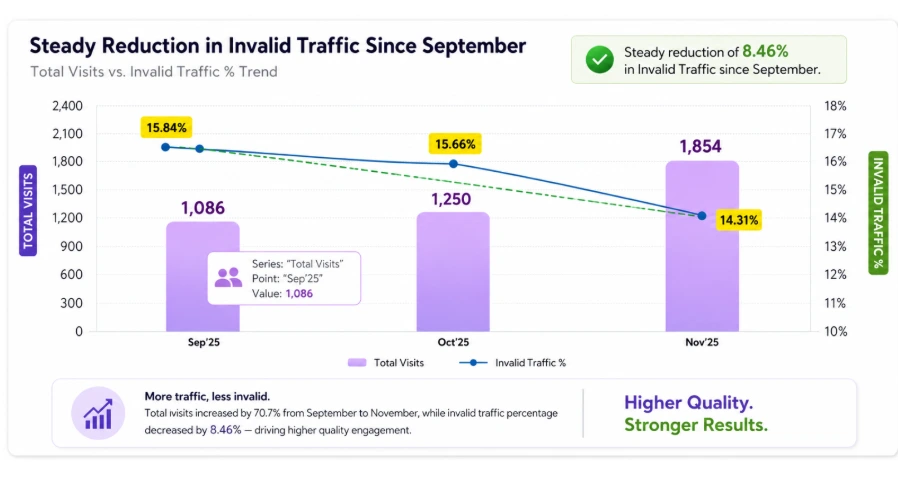
Invalid traffic dropped from 15.84% in September to 14.51% in November—a noticeable improvement over a short period. In Performance Max campaigns, even a single percentage point reduction matters because these campaigns operate at scale and involve higher media spends.
So, while the IVT reduction is 8.4%, the real impact goes beyond that number. Less wasted spend on invalid traffic means more budget is directed toward.
Campaign Performance Over Time: The Impact of Traffic Quality Optimization
Once the blacklisting began, the campaign showed progress in terms of traffic quality in both Google and META campaigns. Let’s see what each denotes –
Performance Improvement in META Campaigns
This table highlights how campaign performance evolved over a five-month period, Initially, when all traffic sources were allowed to run freely during August, the campaign delivered 1,753 clicks and 101 conversions, resulting in a conversion rate of 5.76%. While costs were moderate, performance was held back by poor traffic quality.
As shown in the image below, the conversion rate significantly improves post blacklisting.
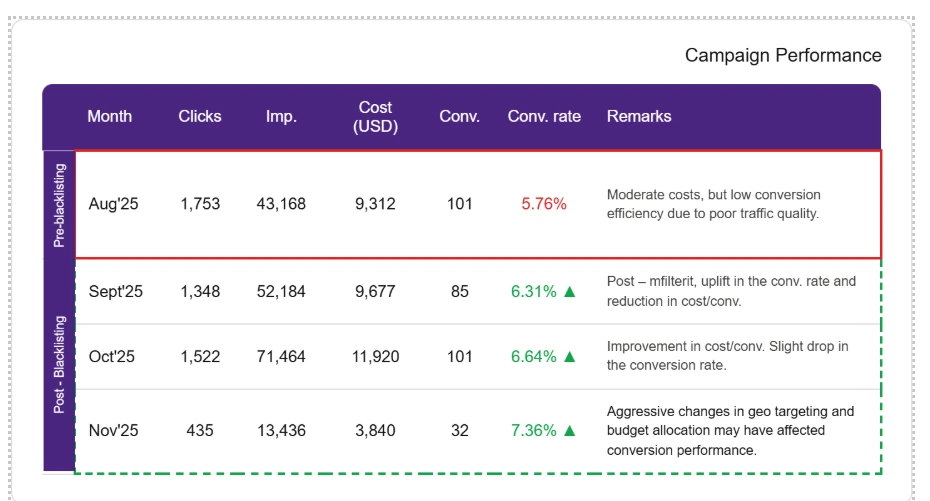
Moving into September 2025, there’s an interesting shift. Although costs increased by 23.5%, the conversion rate improved to 6.31%. This suggests that cleaning up low-quality traffic sources (likely via blacklisting or filtering) began to pay off. Even with higher spend, the campaign became more efficient because the traffic quality improved.
By October 2025, performance stabilizes. Costs remain nearly flat (+0.5%), but the conversion rate climbs further to 6.64%. This indicates that earlier optimizations are holding strong, and the campaign is now reaching a more relevant audience consistently.
In November, the conversion rate jumped to 7.36%. The upward trend in conversion rate from 5.76% to 7.36%; is significant. It reflects a clear improvement in traffic quality and campaign efficiency, not just increased spend or scale.
Performance Improvement in Google Campaigns
The data highlights a clear turning point in campaign performance before and after blacklisting was implemented. In August, the campaign struggled with high cost per conversion (519) and a low conversion rate (0.48%), indicating inefficient spend driven by poor traffic quality.
The campaign improved once blacklisting was brought in action as reflected in conversion rates.
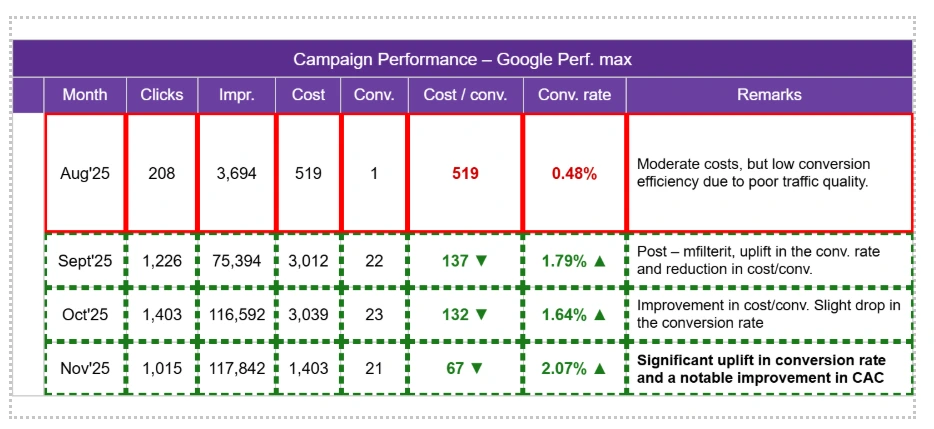
Post-implementation, starting September, performance improved significantly. Cost per conversion dropped sharply from 137 in September to as low as 67 by early November while conversion rates increased from 0.48% to 2.07%. This reflects the direct impact of filtering out low-quality and fraudulent traffic, allowing the campaign to focus on more relevant users.
Overall, the trend demonstrates how traffic quality interventions like blacklisting can significantly improve efficiency and conversion outcomes but also how sensitive performance is to ongoing campaign adjustments
What are the Key Takeaways for Marketers?
This case study reflects what marketers cannot overlook while running their marketing campaigns because this just doesn’t target brands at entry level, the impact travels till the very end, directly impacting your conversion rate. Hence, marketers must not forget the following takeaways to keep their conversion rate flourished –
- Volume ≠ Value: High impressions and clicks don’t guarantee outcomes. Without validating where traffic comes from, campaigns can scale noise instead of performance.
- Source-level visibility is critical: A large share of traffic may never be capable of converting. Breaking performance down by source helps uncover what aggregate metrics often hide.
- Fraud takes multiple forms: VPN/proxy masking, geo fraud, behavior simulation, device repetition, and pop-under traffic each distort signals differently, but all erode conversion efficiency.
- Cleaning traffic improves outcomes even if costs rise initially: Post-blacklisting, conversion rates improve steadily, proving that better inputs drive better outputs.
- Optimization is compounding, not one-time: Improvements are not one-off fixes; they are sustained through continuous validation, filtering, and refinement.
- Better data leads to better decisions: With cleaner traffic, targeting, bidding, and budget allocation become more reliable and effective over time.
Conclusion
Modern performance marketing is no longer just about acquiring traffic — it’s about validating its quality at the source. As this case shows, campaigns on platforms like Google and Meta may look successful on the surface, while hidden invalid traffic quietly impacts performance and wastes ad spend.
The takeaway is clear: traffic quality drives real business outcomes, while traffic volume alone can simply inflate metrics. By focusing on authentic, high-quality traffic, the brand improved campaign efficiency, reduced wasted spend, and achieved stronger ROI.
Ready to improve campaign outcomes with cleaner, high-quality traffic?
Connect with us to discover how intelligent ad traffic validation can drive better conversions.
FAQs
What is invalid traffic (IVT) in digital advertising?
Invalid Traffic (IVT) refers to fake, low-quality, or non-human traffic generated through bots, VPNs, click farms, proxies, device farms, or deceptive ad placements. This traffic inflates clicks and impressions without contributing to genuine conversions, ultimately impacting campaign performance and increasing wasted ad spend.
Why is traffic quality more important than traffic volume?
High traffic volume does not always translate into better results. If campaigns attract low-quality or fraudulent users, marketers may see inflated metrics but poor conversions. Traffic quality ensures that campaigns reach real users with genuine intent, leading to improved conversion rates, lower cost per conversion, and better ROI.
How does blacklisting improve Google and Meta campaign performance?
Blacklisting removes fraudulent or low-performing traffic sources from campaigns. By filtering out sources associated with invalid traffic, fake clicks, geo fraud, or bot activity, brands can improve traffic validation, reduce wasted budget, and optimize campaign performance with cleaner and more reliable data.
What are the most common sources of invalid traffic in campaigns?
Some of the most common IVT sources include VPN/proxy fraud, geo fraud, behavior fraud, device repetition, pop-under traffic, and click farms. These sources manipulate engagement metrics and distort campaign data, making it difficult for marketers to accurately measure performance.
How can brands detect and reduce invalid traffic effectively?
Brands can reduce invalid traffic by implementing traffic validation solutions, monitoring source-level performance, identifying suspicious user behavior, and continuously optimizing campaigns through blacklisting and fraud detection. Regular analysis of conversion quality, engagement patterns, and cost per conversion also helps improve campaign efficiency over time.