Out-of-Stock: Just Lost Sales or More?
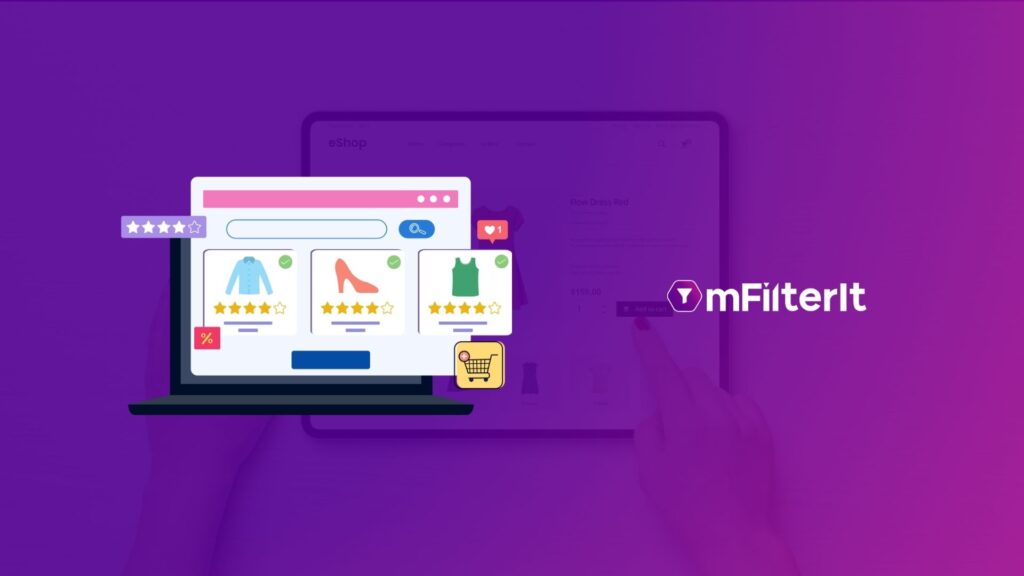
The number of shoppers on established ecommerce marketplaces like Amazon or Walmart is in billions. And thus, the movement of products in terms of sales is at large scale compared to any mom n pop shop. This large movement of products often lead to problem of out of stock (OOS) which can happen due to negligence at multiple steps of the value chain. Brand stakeholders and ecommerce retailers understand that the OOS is going to remain an ongoing problem. The increasing number of visitors to online shopping stores often impacts product demand. eCommerce managers use the best measures to forecast their product demand percentages before informing their authorized sellers of the inventory. Unfortunately, determining the exact product demand is a slippery slope for eCom managers, as the customers’ needs continuously change. The inaccurate forecast of product demand is also linked to other reasons. For example, if your brand is running an online campaign for a specific product and delay in informing the authorized retailers about increasing the inventory of the product. Under such circumstances, the retailers would update the stocks per the previously stated demand. A similar situation could arise if the brand stakeholders delay informing the retailers about updating the stocks of specific products. The unavailability of products on an ecommerce marketplace could also be linked to technical issues, non-compliance with a product page guideline, and other reasons. Although the stockouts reasons are concerning enough for a brand’s stakeholders, the repercussions are equally damaging and sometimes irreversible. OOS not only causes lost sales but also leads to lost customer loyalty and lower visibility on ecommerce marketplaces, to name a few. 3 Biggest Repercussions of Stockouts on Ecommerce Marketplaces Customers opt for an Alternative Product Shopping became easier with the introduction of the ecommerce marketplace. With the launch of quick commerce platforms like BlinkIt, Dunzo, and Zepto, even delivery has become faster. The ecommerce stakeholders continuously work on identifying and resolving the customer’s problem; however, OOS is an ongoing problem. Online shoppers have limited reactions whenever a product becomes out-of-stock. The online shopper may click the ‘notify me when available’ button or buy a substitute. As far as I know, the probability of waiting for a product, especially if it is grocery, is far less than most of the other categories. For example, the likelihood that a customer waits to buy brown bread of a particular brand when it is available is meager. The scenario is more common in quick commerce apps, especially when offering instant home delivery. Under this scenario, the brand has lost sale to competitors and will experience the same until the product become available. Brands Witness a Shift in Loyalty Once an online shopper buys a product and becomes exceptionally satisfied with it, the inclination to buy it repeatedly increases. Such buyers are often referred to as loyalists. But, when the product becomes unavailable on the ecommerce marketplace, one of the subsequent choices of the loyalist is to find a substitute. After using a competitor’s product, the loyalist may change their opinion about the previously bought item and compare its qualities with the new one. As a result, the brand’s loyal customer base shifts to competitors if the product is OOS. Brand stakeholders must expect a higher shift of loyalists towards their competitors if the product remains OOS most of the time. Hampers Search Ranks Significantly Products that become out-of-stock are removed from the search results of ecommerce marketplaces because they spoil customer experience and hamper sales. Instead, new products acquire their search rank and increase their visibility. On Amazon, even if an ecommerce manager updates the inventory, it takes 24-48 hours to review the changes and make the product listing visible to buyers. Re-acquiring the top search rank for the product listing becomes challenging, as the customer’s loyalty has shifted to a competitive product and the consumer’s interest in buying the new & regularly available product has increased. The search rank on ecommerce marketplaces depends on product purchases, best seller, SEO, and other factors. The search results algorithm of the ecommerce marketplaces recognizes the new products attracting the customer’s attention and its visibility as well as search rank improves significantly. Moreover, customers that had the product in their cart but faced stockouts during the final step of the purchase journey often leave negative reviews and ratings. Such feedback further hampers the search rank of the product listings and makes acquiring a high position on keyword search results more challenging. Conclusion We agree that the biggest issue of stockouts is loss of sale, but it also has many other repercussions. It shifts the customer’s loyalty to the competitive brand and hampers the search rank. Inaccurate demand forecasts, sudden demand surge and delayed reporting by inventory managers are the most prominent factors leading to OOS. Ensuring the correct availability of products with authorized online retailers requires diving deep into the stockout vs. stock availability percentages of your brand. It requires identifying the change in these percentages at SKU, platform, variant, and other levels every month . Such in-depth analysis enables brands to diminish their stockout percentage and enhance customer experience. Connect with us to learn the advantages of using our e-commerce competitive analytics solution, mScanIt Ecommerce Analytics Solution, for predicting your product availability at minuscule levels.
Out-of-Stock: Just Lost Sales or More? Read More »