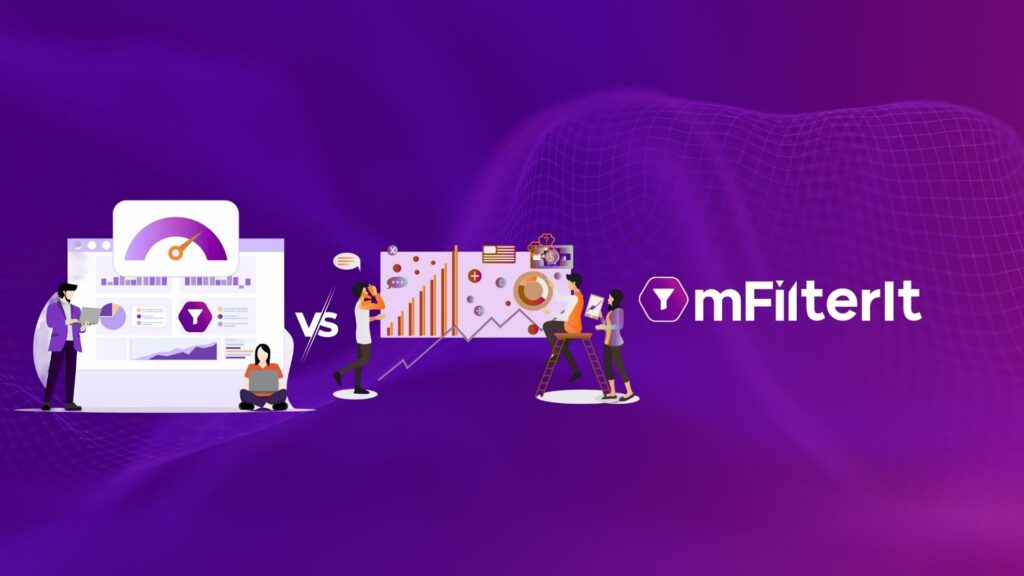
Ad Fraud

Affilate fraud

Affiliate Lead Fraud Exposed: How Fake Leads Hijack Performance Marketing 

Welcome to the world of Pay Per Lead! A more trustworthy and monetized model.  When impressions were being faked, clicks were being hijacked, and brands were receiving barely any conversions. Hence marketers, especially in tier-1 markets like the United States, decided to do what any rational person would do. They stopped paying for clicks and started paying for outcomes. Fill a form, generate a lead, get paid. Simple, accountable, fraud-proof.  The moment payment moved to the lead event; some affiliates simply moved their operation there too. Suddenly, forms were being filled by scripts, credentials were being recycled, and conversion metrics were spiking in ways that looked extraordinary on a dashboard and meant absolutely nothing in a sales pipeline.  The model designed to eliminate fraud became the next frontier for it.  In this blog, we will discover –  What is lead fraud and how affiliates exploit PPL campaigns  What our latest analysis revealed on lead fraud Why your current measures are not enough to tackle lead fraud  What a holistic ad traffic validation solution solves in lead gen campaign  What is Lead Fraud and How Affiliates Exploit Lead Gen Campaigns Imagine opening a lemonade stand and suddenly getting 500 “customers” who ask for lemonade, write down their names, and then disappear before buying anything. Sounds exciting at first until you realize nobody actually wanted lemonade.   That’s exactly what lead generation fraud looks like in digital marketing.  In lead generation fraud, fake demand is created by fraudsters by filling up lead forms with credentials without having any real intent of buying any product/service. This means your brand who has partnered with affiliates are exploiting your marketing campaigns by filling out multiple fake leads and very subtly shifting the burden of non-conversion on sales team.  Lead fraud happens in two ways –  Fake Leads Completely made-up entries with false details, often created by bots. They look like leads but have no real user behind them.   Punched Leads Manually filled leads using random or reused information to hit targets. They seem real but don’t convert when contacted. What is the Mechanic Behind Lead Fraud? Lead fraud is not just another move to pollute your campaigns; it is a very strategic one that is noticeable only when the commission is attributed to partners.  Here’s how affiliate lead generation fraud typically works:  Fake lead generation Affiliates submit fabricated or bot-generated leads using fake names, emails, and phone numbers, often sourced from data dumps or auto-filled by scripts, to hit volume targets and earn commissions.  Incentivized traffic manipulation Real users are paid or incentivized (cash, gift cards) to fill out forms with no genuine purchase intent, inflating lead counts while producing zero conversion value for the advertiser.  Lead recycling Old or previously sold leads are repackaged and resubmitted, sometimes with slightly altered details, to collect duplicate commissions from advertisers who lack deduplication checks.  Cookie stuffing / attribution hijacking Affiliates drop tracking cookies on users’ browsers without their knowledge, falsely claiming credit for leads or conversions that originated organically or through other channels.  Device/IP farming Using emulators, VPNs, rotating proxies, or device farms, affiliates simulate multiple unique users from a single operation, bypassing basic device fraud filters and generating large volumes of fraudulent leads at scale.  Affiliate Lead Fraud Exposed: 44 Leads Tracked to One Cookie Upon analysing the lead generation campaign for a brand that had partnered with affiliates to bring leads, we found severe lead punching use case –  The numbers looked great until they didn’t.  342 leads from just 656 visits. A conversion rate that most marketers would celebrate. On paper, this campaign was firing on all cylinders. In reality, it was being quietly gamed.  The Cracks Beneath the Surface When traffic quality signals were layered over the raw data, the same fingerprints kept showing up — literally. Every suspicious lead traced back to the same affiliate source, the same device, the same desktop environment, the same Delhi location, and near-identical browser signatures. Not similar. The same.  That is not how real consumer behaviour works.  The Day the Mask Slipped The clearest evidence of manipulation surfaced on 06-12-2025. A single cookie ID was used to submit 44 leads in one day. One device. One session fingerprint. Dozens of “different” users.  No genuine audience behaves this way. But an affiliate with a script, a quota, and a commission on the line? Absolutely.  The Graph Doesn’t Lie Conversion rates don’t naturally leap from baseline to 13%, then 21%, then 33% in a matter of days. Organic growth curves they don’t spike like a heart monitor. When they do, it almost always points to the same culprits, automated submissions, recycled user pools, or incentivised form-filling dressed up as real demand.  The Real Cost of Fake Leads This is where the damage moves from a data problem to a business problem. Behind every inflated metric sits a real consequence sales teams burning hours chasing contacts who never existed, budgets being doubled down on channels that are actively cheating, and acquisition cost calculations built on a foundation of fiction.  The campaign looked like a success. The business was paying for failure.  What This Should Change Affiliate marketing remains one of the most powerful growth levers available — but only when the leads coming through it are real. The moment you measure performance purely by volume and conversion rate, you hand fraudulent affiliates exactly the playbook they need.  The brands winning this battle are looking deeper: behavioural patterns, device consistency, cookie-level tracking, and source-by-source forensics. Because in a world where lead generation fraud is this sophisticated, the only defence is an equally sophisticated offence.  Why Surface Level Analysis is not Enough to Detect Lead Fraud Lead exploitation is a broader ecosystem with affiliates disrupting the campaigns through sophisticated tactics. Surface level solution only covers the basic obvious signals like duplicate signals and repeated IP addresses but not something advanced, here’s why they aren’t enough –  Fraud has moved from pattern to behaviour: Basic filters catch duplicate emails and repeat IPs, but sophisticated affiliate fraud rotates identities, devices, and locations specifically to avoid these checks.   Fraudsters map your rules before they operate: Conversion thresholds, IP blacklists, and volume caps are not deterrents, they are a blueprint. Fraud operations stay comfortably within every limit your detection layer has published.  Surface tools measure outputs, not intent: They confirm a lead arrived. They cannot see the 400-millisecond form fill, the missing scroll behaviour and the

Affiliate Lead Fraud Exposed: How Fake Leads Hijack Performance Marketing  Read More »

Affiliate Fraud

Affiliate Traffic is Not Always High Intent. What is Affiliate Fraud and How It Impacts Campaigns

Affiliates only get paid when a user takes a defined action, a lead, an install, or a purchase. So, the traffic must be intent-driven?  But that’s not the case everytime. Why? Because affiliate fraud exists. And it’s more common and sophisticated than marketers realize.  Fraudsters manipulate the payment models by generating fake traffic, fake leads, bot installs, duplicate accounts, organic hijacking, etc. The catch is they make all this look legitimate that makes ad fraud even more difficult to detect.  Therefore, in this blog, we are going to break the myth about affiliate marketing most advertisers still believe in.   Affiliate Traffic is Always High Intent.   The answer is not always. Affiliate traffic you’re paying for may not be as genuine as it appears. Continue reading further to know how affiliate traffic fraud impacts campaign performance.  What is Affiliate Fraud? Affiliate fraud is when fraudulent affiliate partners manipulate the system to generate fake actions like leads, installs, or conversions that appear genuine. The purpose is to earn commissions without delivering value.   Effective affiliate fraud detection helps marketers identify and prevent such fraudulent activities before they impact campaign performance Many affiliates prioritise volume over quality. Hence, the vulnerability to ad fraud and manipulation of results.  Here are some of the common affiliate fraud tactics they use Lead punching Fake or low-quality leads are submitted deliberately to trigger payouts. This is usually done using bots or fabricated data to fill in lead forms in bulk.  Cookie stuffing Affiliates drop tracking cookies on a user’s browser through extension downloads, redirects, pop-ups, or hidden scripts. Users then get tagged with that cookie even though they never interact with affiliate’s content.   Know more about cookie hijacking in detail here.  Incentivized installs Users are paid to install an app, with zero genuine interest in it. This happens when fraudulent affiliates use reward-based platforms or unapproved promotions on various platforms to drive installs, leading to high uninstall rates and lower LTV.  Referral and coupon fraud Fake or duplicate accounts are created just to claim referral rewards. Affiliates exploit loopholes in referral or promo systems using multiple identities, devices, or disposable emails to generate repeated payouts.  Validation spoofing Fraudulent signals are engineered to pass quality checks. This happens when attackers manipulate device data, IPs, or behavioral patterns to make fake leads appear legitimate during verification.  Bot-generated form fills Automated bots fill out forms at scale to manufacture leads. Bots mimic human behavior to submit large volumes of fake entries, inflating lead counts without real user intent.  Organic traffic misattribution Affiliates manipulate last-click hijacking attribution to hijack organic traffic and conversions. They inject tracking links at the final stage of a user journey, overriding the original source and falsely claiming credit for the conversion.  What Real Campaign Data Analysis by mFilterIt Reveals About Affiliate Fraud Across audited campaigns, up to 35% of affiliate traffic shows signs of bot involvement, inorganic behaviour, or misattributed organic actions.  Case Overview 1: Lead punching by an automobile brand’s affiliate partner A major global automobile brand was running affiliate campaigns to drive specific conversion events. In this case, customers completing a “cash thank you” or “lease thank you” action after a vehicle transaction.  The numbers looked fine from the outside. But when the campaign was audited, the findings were alarming.  70% of all invalid traffic traced back to a single affiliate partner. That one partner had a 74% invalid visit rate, and an 86% invalid event rate. In plain terms: nearly 9 out of every 10 conversion events attributed to that affiliate were fraudulent.  The company had been paying for results that didn’t exist.  Case Overview 2: Referral coupon fraud under the name of a global petroleum brand A global petroleum brand was running customer acquisition campaigns and spending well on them. But lead quality was still poor, and referral coupons were being flagged for suspicious activity.  When the mFilterIt SDK was deployed to analyse install-level data, the truth came out.  Of all the app installs that appeared to be clean and legitimate, 21% were actually referral coupon fraud. Automated bots or fake users were simply creating fake and duplicate accounts to claim referral incentives, with no intention of becoming actual customers. One geography alone accounted for 76% of that coupon fraud.   The Impact: How Affiliate Fraud Damages Your Business Outcomes? When affiliate fraud goes undetected, the impact ripples across your entire marketing operation:  Your sales pipeline fills with unqualified and fake leads that waste your team’s time.  Your CPA and CPI benchmarks look artificially efficient, so you keep spending on the wrong sources.  Your budget gravitates toward the channels “performing” best, which are often the most fraudulent.  Channels that are actually working get defunded because they can’t compete with inflated affiliate numbers.  How to Protect Marketing Budget from Affiliate Fraud with mFilterIt’s Affiliate Fraud Detection Solution? mFilterIt provides a full-funnel ad fraud detection solution that gives marketers visibility at every stage of the affiliate journey, not just at the click level, but all the way through installs, events, and conversions. It helps you:  See where your traffic is actually coming from, identify underperforming or suspicious affiliate partners before they do more damage.  Catch attribution manipulation, detect when genuine conversions are being falsely claimed by affiliates who had no real role in driving them.  Spot incentivized users early, flag users who only took action to claim a reward, with zero intention of sticking around.  Monitor referral and coupon activity in real time, identify patterns of abuse before they inflate your acquisition numbers.  Validate traffic before it enters your funnel, filter out bots, fake devices, and spoofed signals at the pre-install stage itself.  The result?   You stop paying for performance that was never real and start making budget decisions based on data you can actually trust.  For a deeper look at how affiliate fraud shows up across different campaign types and what to watch for at each stage, read our complete Affiliate Fraud Guide for Marketers.  Conclusion Affiliate marketing isn’t the problem. Blind trust in it is.  When you assume every action is genuine, fraudsters win. When you start auditing affiliate data correctly, you take control back and start seeing genuine results.  Your affiliates should be working for your growth. Not against it.  Find out what your affiliate partners are driving for you and how much of your affiliate spend is delivering real results. Connect with mFilterIt experts now.  Frequently Asked Questions What is affiliate fraud and how does it work? Affiliate fraud is when fraudulent affiliates manipulate the payout system to earn commissions without delivering real users. They do this by generating fake leads, bot installs, duplicate accounts, or stealing credit for conversions

Affiliate Traffic is Not Always High Intent. What is Affiliate Fraud and How It Impacts Campaigns Read More »

What Is Frequency Capping? Why It Matters in Digital Advertising Campaigns? 

You see the same ad once. Fine.  Twice? Still okay.  But by the increasing number of times in a day, it stops being memorable and starts becoming annoying.  Now flip the perspective.  As an advertiser, you’re paying for each of those impressions, assuming you’re reaching new users. But what if you’re not? What if your campaign is just circling around the same audience again and again? This is exactly what happens when frequency capping fails.  To understand this in detail, let’s dive deep and know what frequency capping is and how to prevent breaches effectively.  What is Frequency Capping?  Frequency capping simply controls how often the same person should see your ad within a given time period. The idea is straightforward, instead of showing the same ad to one user ten times, the system distributes those impressions across multiple users. This ensures that campaigns expand their reach, avoid overexposure, and maintain efficiency.  When implemented correctly, frequency capping helps maintain a balance between visibility and user experience. It prevents fatigue, protects brand perception, and ensures that budgets are used to reach more potential customers, not just the same ones repeatedly.  However, this balance only exists when the cap is actually followed during ad delivery which is where things often start to break down.  Campaigns today run across multiple exchanges, devices, and tracking systems. A single user may interact with ads through different browsers, apps, or devices, each generating separate identifiers. What appears to be “one user” in reality becomes multiple fragmented identities within the ecosystem.  What Frequency Capping Violations Look Like in Real Campaigns  Frequency capping breaches may not always stand out in summary reports, but they become very clear when you look closely at delivery data.  In a campaign analysis, a frequency cap of 3 impressions per device was clearly defined. The expectation was simple once a device reached this limit, further ad delivery should stop. However, the actual delivery pattern showed a clear breach.   A single device recorded 2,112 impressions during the campaign period. This is far beyond the defined cap and highlights a direct failure in enforcement. What makes this more concerning is not just the number, but the pattern. The same device continued to receive ads repeatedly, indicating that the system was not stopping delivery even after the cap was exceeded. Instead of controlling exposure, the campaign allowed unrestricted ad repetition at the device level.   This clearly shows that when we expand beyond a single device, the pattern becomes more widespread. Multiple device IDs showed unusually high impression counts:  Several devices crossed 1,000+ impressions.   Others also stayed between 800 and 1,600 impressions.    This shows that the issue was not isolated; it was happening across multiple devices. At this point, the campaign stops behaving like a reach-driven campaign. Instead of distributing impressions across a larger audience, it begins to concentrate delivery on a smaller group of users.   According to the analysis, the first device ad request of 2,112 times was shown at 2:00 pm in the afternoon. Likewise in other devices, the ad request showed multiple times that were distributed in different time periods.   This analysis highlights three key signs of frequency capping breaches here:  A small number of devices generating a disproportionately high share of impressions   Repeated delivery far exceeding the defined frequency cap   Growing impressions without a meaningful increase in reach   Why This Matters More Than It Seems  At first glance, frequency capping violations may not appear critical. Campaigns continue to deliver impressions, and performance metrics may seem stable. However, the real impact becomes clear when you look at how those impressions are distributed.  When the same users are repeatedly exposed to ads, it starts affecting the campaign in multiple ways:  Reduced effective reach – instead of reaching new users, the campaign stays limited to a smaller audience   Budget inefficiency – spend is wasted on repeated impressions that add little incremental value   Lower engagement rates – users become less responsive when they see the same ad too often   Over time, these effects build up and quietly reduce overall ad campaign performance, even when the campaign appears active on the surface.  How mFilterIt Helps Control Frequency Capping Violations  Once frequency capping violations are identified, the next step is not just detection but control.  Identifying frequency capping violations is only half the job. The real value lies in controlling them at the moment of delivery. mFilterIt goes beyond just reporting the issue it actively ensures that frequency caps are followed, so campaigns don’t fall into repetitive delivery patterns.  In the above campaign, once excessive ad repetition was detected at the device level, mFilterIt stepped in to restrict impressions beyond the defined cap in real time. This immediately reduced overexposure and allowed impressions to be redistributed more effectively across users.  As a result, the campaign shifted from repeated targeting of a few devices to a more balanced and reach-driven delivery model.  Controlled ad exposure with no frequency overshoot Campaigns stay aligned with defined frequency limits, ensuring that users are not exposed to ads beyond the intended threshold   Minimized repetition and reduced impression wastage  By limiting repeated delivery to the same devices, campaigns avoid spending on impressions that do not add incremental value   Stronger reach through better distribution Impressions are spread across a broader audience, helping campaigns move beyond a limited user pool and improve overall reach   Improved user engagement with balanced exposure  When users are not overexposed to the same ad, they are more likely to stay responsive, leading to better interaction and brand recall    More efficient and performance-driven campaigns With better control over ad frequency and delivery patterns, advertisers can optimize campaigns more effectively and drive stronger campaign performance By combining real-time control with continuous monitoring, mFilterIt ensures that frequency capping is not just a campaign setting but a mechanism that actually works.  Conclusion  Frequency capping is not just about setting limits it’s about making sure those limits are actually followed. When enforcement fails, campaigns lose reach, waste budget, and see a drop in overall ad campaign performance.  To avoid this, advertisers need more than just setup they need continuous monitoring and control over ad delivery. With mFilterIt’s ad fraud solution, you can ensure clean delivery, controlled ad frequency, and better reach quality by filtering out invalid traffic and enforcing caps in real time.  Get in touch with mFilterIt’s experts to take control of your campaign delivery and drive better performance.  Frequently Asked Questions What is frequency capping in digital advertising?  Frequency capping is a setting that limits how many times the same user sees an ad within a

What Is Frequency Capping? Why It Matters in Digital Advertising Campaigns?  Read More »

Invalid Traffic

Traffic Quality vs Invalid Traffic Volume: What Really Drives Campaign Performance?

Every brand’s marketing program runs on one principle – more visits amount to more leads. While Google and META highly influence users’ journey but not all that stands true. The journey is simple but equally prone to the complexities of digital advertising ecosystem. This shifts the real question from how many visits your campaigns generate to where those visits are coming from or if they are leading to any conversions? We saw this firsthand while working with one of the USA’s leading aggregator players. For them, deeper validation of their campaign traffic was the turning point. When they looked closer at where their visits were actually coming from, the picture changed entirely. Irrelevant, low-quality sources were quietly eating into their budget and polluting their campaign data, making it nearly impossible to measure what was truly working. So, they made a call: blacklist the bad sources. Clean the data. And rebuild on a foundation they could actually trust. In this blog, we break down exactly how that played out: Sources that pollute Google and Meta campaigns and their impact How blacklisting changed the game The measurable impact of defending against fraudulent traffic Key takeaways for marketers Conclusion Source-Level Fraud in Google and META Campaigns We did a thorough analysis of the brand’s campaigns running on Google and META and here’s what we found – From META, brand received the highest Invalid Traffic (IVT) of 28.51%. From Google, brand got 8.15% IVT from various fraudulent sources. The difference in invalid traffic across platforms clearly shows that not every traffic source delivers the same quality of users. A campaign may generate high traffic numbers, but that does not always mean the visits are genuine or valuable. In some cases, a large portion of traffic can come from fraudulent or low-quality sources that never convert into real customers. For Google campaigns, the IVT percentage may appear lower compared to other platforms, but the advertising costs on these walled gardens are significantly higher. This means that even a small percentage of invalid traffic can result in substantial budget wastage and reduced campaign efficiency. To understand this better, let’s look at the major sources contributing to IVT and the direct impact they have on marketing campaigns – VPN/ Proxy Fraud: Traffic routed through VPNs or proxy networks to disguise real user identity and location. Impact: Bypasses geo-targeting and fraud filters, making fake traffic appear legitimate. Geo Fraud: Traffic coming from the geographies that were never a target at the first place. Impact: Creates a false sense of campaign success in priority markets.  Behavior Fraud: Bots or automated scripts designed to mimic real user actions like fake clicks, scrolling, session duration. Impact: Inflates engagement metrics while delivering zero real intent. Device Repetition: Repeated interactions from the same device or a controlled pool of devices also called device farms. Impact: Indicates click farms or emulator-driven traffic, skewing user-level data. Pop-Under Traffic: Ads triggered in hidden or background windows without active user intent. Impact: Generates low-quality visits that look like traffic but don’t convert meaningfully.  mFilterIt’s Solution: How Blacklisting Changed the Game for Leading Aggregator mFilterIt transformed campaign performance by shifting the focus from traffic volume to traffic authenticity. Through our ad fraud detection tool, brands attained real-time traffic validation and source-level analysis, identifying and blocking fraudulent or low-quality sources before they impact campaign outcomes.  This enables brands to take precise actions like blacklisting, ensuring that only genuine users move through the funnel. Here’s how it changed the game –  IVT Dropped by 42% in META Campaigns What began at 38% dropped down to 22% in just three months, a major 42% reduction in IVT.   This was not a one-time correction; it indicates a consistent, ongoing improvement driven by focused campaign optimization.  As deeper traffic validation was done and low-quality sources were identified, the system was able to filter out fraudulent sources such as geo-masking and repeated device activity. Over time, this led to cleaner inputs, better targeting decisions, and more reliable performance signals.  The continuous decline also indicates that optimization efforts didn’t just remove existing fraud but actively prevented its recurrence.  IVT Dropped by 8.4% in Google Performance Max Campaign  Below graph highlights reduction of IVT in Google performance max campaigns by 8.4%.  Invalid traffic dropped from 15.84% in September to 14.51% in November—a noticeable improvement over a short period. In Performance Max campaigns, even a single percentage point reduction matters because these campaigns operate at scale and involve higher media spends.  So, while the IVT reduction is 8.4%, the real impact goes beyond that number. Less wasted spend on invalid traffic means more budget is directed toward. Campaign Performance Over Time: The Impact of Traffic Quality Optimization Once the blacklisting began, the campaign showed progress in terms of traffic quality in both Google and META campaigns. Let’s see what each denotes –  Performance Improvement in META Campaigns This table highlights how campaign performance evolved over a five-month period, Initially, when all traffic sources were allowed to run freely during August, the campaign delivered 1,753 clicks and 101 conversions, resulting in a conversion rate of 5.76%. While costs were moderate, performance was held back by poor traffic quality.  As shown in the image below, the conversion rate significantly improves post blacklisting.  Moving into September 2025, there’s an interesting shift. Although costs increased by 23.5%, the conversion rate improved to 6.31%. This suggests that cleaning up low-quality traffic sources (likely via blacklisting or filtering) began to pay off. Even with higher spend, the campaign became more efficient because the traffic quality improved.  By October 2025, performance stabilizes. Costs remain nearly flat (+0.5%), but the conversion rate climbs further to 6.64%. This indicates that earlier optimizations are holding strong, and the campaign is now reaching a more relevant audience consistently.  In November, the conversion rate jumped to 7.36%. The upward trend in conversion rate from 5.76% to 7.36%; is significant. It reflects a clear improvement in traffic quality and campaign efficiency, not just increased spend or scale.  Performance Improvement in Google Campaigns The data highlights a clear turning point in campaign performance before and after blacklisting was implemented. In August, the campaign struggled with high cost per conversion (519) and a low conversion rate (0.48%), indicating inefficient spend driven by poor traffic quality.  The campaign improved once blacklisting was brought in action as reflected in conversion rates.  Post-implementation, starting September, performance improved significantly. Cost per conversion dropped sharply from 137 in September to as low as 67 by early November while conversion rates increased from 0.48% to 2.07%. This reflects the direct impact of filtering out low-quality and fraudulent traffic, allowing the campaign to focus on more relevant users.  Overall, the trend demonstrates how traffic

Traffic Quality vs Invalid Traffic Volume: What Really Drives Campaign Performance? Read More »

invalid traffic

What is Invalid Traffic and How Does It Impact Your Ad Campaign Performance?

Are you proactively analyzing the ad traffic of your campaigns?   Is it really coming from genuine users or just being generated by bots?  Yes, a significant portion of traffic that makes your ad campaigns seem successful could be invalid traffic. According to mFilterIt’s analysis featured in FICCI Report 2025, invalid traffic contributes to as much as 30–50% of activity across digital channels, directly distorting performance metrics and draining ad budgets.  This means the performance you see on dashboards may not always reflect real user intent. Instead, it could be influenced by automated systems, proxies, or manipulated interactions that inflate impressions, clicks, and even conversions.  In this blog, we break down what invalid traffic really is, why it’s increasing, differences between general invalid traffic and sophisticated invalid traffic, and how you can identify and mitigate its impact to ensure your campaigns deliver genuine results.  What is Invalid Traffic? Why is it Increasing Rapidly? Invalid traffic simply means ad activity that doesn’t come from real users but still shows up as genuine impressions, clicks, or visits. This happens when bots or automated systems interact with ads, making it look like people are engaging when they actually aren’t.  Over time, this traffic has become more advanced and harder to spot. Bots now easily mimic real user behaviour, such as browsing pages, scrolling, or clicking on ads.  Moreover, developments in technology, AI usage, and advertising infrastructure also contribute to this. Here’s how:  AI is making bots smarter Earlier, bots were easy to detect because they behaved like machines. Today, AI-powered bots can scroll, pause, click, and even mimic browsing patterns. Some can simulate entire user journeys, making fake engagement look real in analytics tools.  The ad ecosystem has become more complex Modern advertising runs through multiple layers and channels, DSPs, SSPs, ad exchanges, networks, and resellers. This fragmentation creates blind spots, making it easier for low-quality or fraudulent traffic to enter without being noticed.  Cheap infrastructure fuels large-scale ad fraud Server farms allow fraudsters to generate massive volumes of ad traffic at very low cost. What once required physical devices can now be scaled instantly using virtual environments.  Limited transparency and visibility Limited transparency and visibility across the digital ecosystem make it harder for advertisers to verify traffic quality. With restricted access to detailed user-level data, identifying whether engagement is coming from real users or sophisticated invalid traffic becomes more challenging.  As long as advertisers pay based on clicks or impressions, there’s always a chance for misuse. Fraudsters take advantage of this by generating invalid clicks or views to earn money, especially when proper checks are not in place.  Therefore, detecting invalid traffic has become more important than ever. Invalid traffic is generally classified into two main types: General Invalid Traffic (GIVT) and Sophisticated Invalid Traffic (SIVT).  Two Major Types of Invalid Traffic Invalid traffic is broadly classified into two categories based on how complex the fraud technique is.   What is General Invalid Traffic (GIVT)? It refers to non‑human or automated interactions that inflate ad metrics, caused by easily identifiable bots, spiders, or crawlers. These bots typically do not attempt to mimic real human behavior. They’re not malicious in intent but can distort campaign reporting and waste ad spend due to their automated nature.  Because the patterns are predictable, platforms and verification tools can often identify and block this traffic using ad fraud detection techniques.  Here’s what we observed in one of the campaigns . VPN and proxy traffic contributed 12.4% of total activity, indicating that a significant portion of traffic was not genuinely coming from real users.  Several visits appeared to come from genuine mobile users but traced back to VPN and proxy networks, that were being used to hide the real user’s location. A deeper analysis showed that these IP addresses were linked to data center hosting providers (DCH) instead of real user networks.   What is Sophisticated Invalid Traffic (SIVT)? Sophisticated Invalid Traffic (SIVT) refers to advanced forms of fraudulent or non-genuine traffic that are designed to look like real user activity. Unlike basic invalid traffic, these methods use automation, scripts, or manipulated devices to mimic real behavior, making them harder to detect with simple filters.  Here are some sophisticated invalid traffic techniques we have observed in various campaign analysis:  Sample Observation 1:   In this case, the sophisticated invalid traffic technique that is being used is pop-under activity. It occurs when a website opens in the background instead of the active browser tab, meaning the user does not actually see or interact with the page.  This is what we observed: the page loaded behind the main window and showed no real user interaction, indicating artificially generated visits. This type of activity is used to inflate traffic numbers without genuine engagement, and here, pop-under traffic contributed about 6.1% of the total traffic.   Sample Observation 2:  This shows a case of device spoofing, where traffic pretends to come from a real mobile device. Normally, smartphones support touch actions like tapping, scrolling, or pinch-zooming. However, in the above data, some devices marked as mobile showed “Not Standard” touch support, meaning these normal mobile features were missing.  This suggests that the devices were not real smartphones but simulated environments or automated systems pretending to be mobile users. In this analysis, device spoofing made up about 2.7% of the traffic, indicating automated activity trying to appear like real user interactions.   Sample Observation 3:   Server farm-driven activity contributed 3.2% of total traffic, highlighting the presence of sophisticated, non-human interactions.  In this case, traffic appeared to come from mobile devices across different sources. We noticed very high hardware concurrency values (192 and 96) from devices shown as mobile. Hardware concurrency simply means how many tasks a device can handle at the same time. Normal mobile phones can only run a limited number of tasks, so numbers this high are unusual for real users.  This suggests that the traffic is likely coming from multiple channels, like bot farms, proxy-based execution, and automated browsers instead of real mobile devices. These systems are

What is Invalid Traffic and How Does It Impact Your Ad Campaign Performance? Read More »

How Fraudsters Bypass MMP Detection in USA

How Fraudsters Bypass MMP Detection

Mobile Measurement Partners (MMPs) have long been the industry’s first line of defence against mobile ad fraud. Through SDK integrations and last-click attribution, they have helped brands track installs and flag suspicious activity based on known patterns such as:  Unusual install spikes   Abnormal click-to-install times   Repetitive device IDs   While this works well for obvious fraud, the challenge today is far more sophisticated.  Fraudsters now mimic normal user behaviour, making fraudulent traffic look genuine. In many cases, they have effectively reverse-engineered MMP detection logic and learned how to stay within acceptable thresholds.  By carefully blending different traffic types in calculated proportions, bad actors are able to pass MMP checks and continue draining campaign budgets unnoticed.  This is why the common concern today is clear: MMPs catch obvious fraud but often miss blended fraud.  In this blog, we cover:  Why MMPs struggle to catch blended traffic   How mixed traffic gets a green signal in campaigns   How brands can protect themselves beyond basic MMP checks  Why MMPs Struggle to Catch Blended Traffic MMPs are designed to detect fraud using known red flags such as unusual click-to-install times, or repetitive user behavior.  But today’s fraudsters have become smarter. Instead of sending clearly fake traffic, they mix fraudulent activity with genuine users so that nothing looks suspicious at first glance. This makes the traffic appear legitimate on the MMP dashboard, while budgets continue to get quietly drained in the background.  Bot Traffic – Hiding Behind Volume Bots generate large volumes of clicks and fake installs, creating an illusion of strong campaign activity. When this fake traffic is mixed with real users, the overall data starts to look normal. Click and install ratios are high where one click is followed by one install hence time patterns seem balanced, device IDs appear varied, and nothing stands out as an obvious anomaly.  Because MMPs are typically built to detect extreme outliers, this blended fraud often slips through unnoticed.  Last-Click Attribution – Stealing Credit for Real Installs In fraud tactics like click spamming and click injection, fraudsters either flood the system with fake clicks or place a click just before a real user completes an install. This helps them hijack last-click attribution and steal credit for a conversion that should go to a genuine source.  Since the install itself is real, the MMP often treats it as genuine. The fraud happens at the click stage, which many surface-level detection models fail to catch effectively.  Incentivised Traffic – Real People, Misleading Results This is one of the hardest forms of fraud to detect because it involves real people. Users are paid or rewarded to install an app, so all the signals look human; real IP addresses, normal device behavior and natural session activity.  To an MMP, this traffic appears completely clean. The problem usually becomes visible only later, when retention and engagement suddenly drop after the campaign budget has already been spent.  Read in detail about device fraud How the Data Exposes the Evasion, MMPs Cannot Detect The data below highlights findings from a campaign ran between Sept–Oct 2025, where bot traffic was mixed with organic installs, making it difficult for MMPs to separate real activity from fraudulent traffic. Here’s what the data shows:   The conversion rate gap is the clearest proof of hidden invalid traffic: The top source, publisher 1, shows conversion rate falling from 0.24% to 0.10% after bot traffic is removed, meaning nearly 58% of the apparent performance was artificial uplift.  Massive click volume is creating a false sense of scale: Publisher 8 delivered 816M clicks, but its clean CVR drops to just 0.02%, huge activity on paper, but almost no genuine conversion value.  Strong reported CVR can still hide severe bot contamination: Publisher 11 appears to be a top-performing source with 0.63% reported CVR, but once bots are removed it drops to 0.18%, with 72% bot share, indicating invalid traffic driving the most performance. Bot-heavy traffic is not an outlier – it is widespread: 7 out of 10 visible publishers show bot share above 60%, including sources like publisher 5 (68%), publisher 9 (70%), and publisher 10 (70%), despite all of them marked as clean by MMP.  Even mid-volume sources show inflated performance: Publisher 7 drops from 0.20% to 0.08% CVR, while 61% of its traffic is bot, showing that inflation is not limited to only the largest traffic sources.   The most dangerous fraud isn’t what MMPs catch, it’s what they don’t. Understanding the evasion tactics is the first step to building detection that actually keeps up.  How Brands Can Protect Themselves from Mixed Traffic Beyond Basic MMP Checks MMPs should be treated as the first layer, not the only layer. An independent layer of validation through mobile ad fraud solution like mFilterIt’s empowers brands against mixed traffic, catching sophisticated tactics that MMPs miss –   Recover stolen conversions through full click-path validation: Move beyond last-click attribution to validate the complete user journey from first touch to install so click hijacking and attribution theft are identified before they drain budgets.   Pinpoint fraud sources with publisher-level transparency: Gain granular visibility down to publisher, sub-publisher, placement, and traffic source level to isolate hidden fraud pockets and eliminate waste at the source.   Improve acquisition quality by validating real user intent: Go beyond app install counts and measure retention, session depth, registrations, and purchase signals to separate genuine users from low-intent or incentivised traffic.   Surface blended fraud early with CVR and traffic anomaly detection: Monitor conversion gaps, abnormal click bursts, and sudden traffic mix shifts to detect bot-driven or manipulated traffic before it impacts performance metrics.   Conclusion Blended fraud is changing the way brands need to think about campaign validation. What once appeared as a reliable defence layer is now being challenged by fraud tactics that are far more calculated and harder to spot.  This makes it critical for brands to look beyond standard MMP signals and adopt deeper monitoring frameworks like mFilterIt’s Valid8 that can uncover hidden manipulation across clicks, installs, and post-install behaviour.  In a high-investment digital ecosystem, protecting media spends is no longer just about catching obvious fraud, it is about identifying the traffic that is intentionally built to look real.  FAQs How do fraudsters bypass MMP detection? They mix fake traffic with real user activity, making fraud look genuine and harder for MMPs to detect. Why do MMPs miss blended fraud? Because blended fraud mimics normal user behaviour and stays within acceptable detection thresholds. What are click injection and click spamming? These are fraud tactics that use fake clicks to steal credit for genuine app installs. How can brands detect

How Fraudsters Bypass MMP Detection Read More »

Cookie Hijacking Fraud in USA

$14.8B at Stake: Will You Let Cookie Hijacking Slip Through?

The U.S. affiliate marketing industry is entering a new phase of scale. It is crossing the $10 billion mark for the first time, up from $9.1 billion in 2023, and projected to reach $14.8 billion by 2028. With giants like Amazon, Walmart, and Target running large, complex affiliate programs, the stakes have never been higher. But as the channel grows, so does the race to claim commissions (sometimes wrongfully) which can also look like this-imagine a shopper comes directly to your website, ready to buy but yet somehow, a third-party partner ends up taking creadit for that sale. Many brands are already trying to tackle it, but the growing sophistication of the tactic makes it increasingly difficult to control. In this blog, we dive into a sophisticated tactic known as cookie hijacking where affiliate cookies are secretly inserted into a user’s browser to claim credit for organic traffic, ultimately stealing conversions that rightfully belong to the brand. Behind the Scenes of Cookie Hijacking: 3 Tactics You Might Be Missing Here are three common ways affiliates cause cookie stealing to hijack organic traffic: Extensions Injecting Cookie Affiliates driving sales by influencing real customers is ideal but them stealing is not. One common way an affiliate program experiences this issue is through cookie hijacking. While analyzing a leading global e-commerce platform, we found that many users were directly visiting the site to make purchases. However, some had browser extensions installed (like coupon or deal tools) that silently triggered affiliate links in the background, without any click or user consent. As a result, when the purchase was completed, the system attributed it to an affiliate. Since most tracking follows a “last click wins” model, the affiliate whose cookie was dropped last received the credit, despite having no real influence on the sale. Auto-redirect with Affiliate Tag Another way of cookie hijacking that we noticed in the same brand’s use case was, the page as when users were redirected to brand’s website. If a user is browsing normally and visits a random page (this could be a shady site, popup, or even hidden script). The page quickly redirected them to brand’s site and in a split-second redirect, an affiliate cookie is dropped silently. When that user makes purchase, the credit is given to the affiliate as system sees the cookie. Forced cookie from an external site A user visits a completely unrelated website, not your brand’s. In the background, that site quietly drops an affiliate cookie without the user clicking anything or showing any intent. Sometimes, the user is even redirected to your website, making it look like a normal visit. Later, when they make a purchase, the affiliate gets credit, simply because their cookie was already placed earlier. How Can You Safeguard Your Brand From Cookie Hijacking Cookie manipulation is a growing risk for U.S. brands, especially those running large-scale affiliate programs. As partner ecosystems expand, having clearer visibility becomes essential to avoid affiliate fraud and protect genuine performance. Legacy, surface-level tools can highlight obvious issues, but the real question is whether they can keep up with increasingly sophisticated fraud tactics. In most cases, they fall short. And for U.S. brands running high-stakes affiliate programs , uncertainty isn’t something they can afford. With a more advanced, third-party approach like mFilterIt’s, renowned brand are already bringing more transparency to their affiliate marketing programs. Here’s how it empowers brands- Launch instantly, stay in control – No integrations needed, just immediate visibility into your affiliate ecosystem Gain complete transparency – Always-on scanning ensures you see every leakage, not just the obvious ones Expand your risk coverage – Protect your brand from both known partners and unknown bad actors Make decisions with confidence – Accurate, low-noise insights you can actually act on Hold the right partners accountable – Clear attribution helps you take precise, effective action Understand your true customer journey – See exactly how users reach and convert on your platform Protect revenue in real time – Identify and stop fraud before it impacts your bottom line Conclusion The key to a smooth affiliate program is visibility to understand real user journeys and know where attribution is coming from. Brands that focus on transparency and proactive monitoring through holistic ad fraud solution can prevent revenue leakage and build stronger, more reliable affiliate programs. FAQs What is cookie theft? Cookie theft is when someone steals a user’s cookie or places their own cookie in the user’s browser to wrongly take credit for a purchase they didn’t influence at the first place. How to prevent cookie hijacking? Monitor affiliate traffic and user journeys closely Block suspicious extensions, redirects, and unknown sources Validate partners and enforce strict program rules Use advanced tracking/monitoring tools for better visibility Why is cookie hijacking difficult to identify? Cookie hijacking is difficult to identify because it often happens silently in the background. Since the user still completes a genuine purchase, the fraud appears legitimate in standard attribution systems, making it harder for legacy tools to flag. What are the common signs of cookie hijacking in affiliate programs?  Common signs include sudden spikes in conversions, abnormal click patterns, high traffic from unknown sources, and mismatched user journeys that indicate unauthorized tracking activity  What impact does cookie hijacking have on attribution and commissions?  Cookie hijacking manipulates attribution by assigning credit to fraudulent affiliates, leading to incorrect commission payouts and reduced returns for genuine marketing efforts.  What compliance measures help prevent affiliate fraud in the US?  US advertisers can enforce strict affiliate policies, conduct regular audits, use fraud detection tools, and follow FTC guidelines to ensure transparency and prevent fraudulent activities. 

$14.8B at Stake: Will You Let Cookie Hijacking Slip Through? Read More »

ad fraud

What 756+ Million OTT Ad Requests Revealed About Where Media Budget Really Goes

OTT advertising seems to be a safe bet right now. Brands are moving serious budgets here to reach a wider segment of audience at once.   In 2025, 28% of total digital ad spend in India was heavily driven towards OTT platforms and video content. (Source: Exchange4Media)  But what if we told you that the audience pool that you are reaching right now is limited? The numbers that you see on your dashboard are not always true.   This is exactly what came to light during a recent campaign analysis we conducted for a large automotive brand running video ads across two of India’s leading OTT platforms. We went beyond what the platform reported and validated what was actually happening at the delivery level. Over 756 million ad requests were reviewed across three months.  Here’s what the data revealed, and what it means for every marketer running branding campaigns on OTT today.  The Scale of the OTT Advertising Campaign & Why It Matters  The campaign ran across two major OTT platforms simultaneously, covering both CTV and mobile inventory. It covered multiple brand lines, from regional language campaigns tied to popular content properties, to national-market brand pushes. In total, over 756 million ad requests were reviewed during the assessment period.  Across Platform A, 1.18% of ad requests were blocked before delivery. However, the figure was significantly higher at 7.41% for Platform B.  This gap between the two platforms is not incidental. It reflects differences in inventory quality, frequency capping behavior, and bot traffic patterns.   Finding 1: Frequency Capping Violations – The Reach Problem Hiding in Plain Sight  A frequency cap exists for two reasons:   To protect the viewer from ad fatigue  To protect the advertiser from burning budget on an audience that has already been saturated.   When it is not enforced at the delivery level, both goals fail simultaneously.  In this campaign, frequency overshoot was the single largest driver of blocked impressions, particularly on one of the two platforms, where it ran as high as 8.32% in a single month.   At the device level, the problem was even more stark. A single CTV device was found to have accumulated 711 ad requests over a span of just 10 days, against a defined frequency cap threshold of 3 impressions per device. Multiple other devices on the same campaign showed repetition counts ranging from 245 to 510 requests across the same period.  Action Taken to Prevent Frequency Capping Breaches Every ad request was evaluated in real time against the predefined frequency capping before the impression was served. When a device had already crossed its exposure limit, the ad request was blocked automatically.   Impact  Impression delivery shifted from repeatedly exposed devices to a new audience base.   Budget was redirected toward incremental reach.   Reach distribution became more balanced across devices.  Every counted impression met the defined frequency and traffic quality thresholds  Finding 2: Brand Safety – What Content Were the Ads Actually Running Against? Brand safety on OTT is not a binary condition; it depends on what specific content a particular ad placement is running against, and whether anyone is actually checking.  During this campaign, content-level placement analysis was conducted using Video ID signals available from the platforms. It revealed that a portion of ad impressions were being served alongside content that no automotive brand would knowingly approve.  Specific placements were identified and blocked that fell into the brand unsafe content categories:  1. Obscenity & Profanity: Adult content classified under the GARM video safety framework  2. Crime & Harmful Acts: Films with depictions of violence and criminal activity  3. Arms & Ammunition: Content featuring weapons as a central theme  4. Illegal Drugs: Content involving drug-related imagery  These were not obscure placements on low-quality inventory. They were identifiable content URLs on mainstream OTT platforms, surfaced through systematic placement-level analysis.  Action Taken to Prevent Ad Placements Besides Unsafe Content Each placement was analyzed based on text, frame-by-frame classification, and GARM-aligned video-level analysis. Once categorized as brand-unsafe, impressions associated with those placements were blocked from delivery. This ensured that the   Impact  Brand ads appeared only against content that met its defined safety standards.  No brand-unsafe impressions were counted as delivered.  Brand’s media team received verifiable assurance, not just a platform-level declaration.  Brand integrity was protected at the most granular level possible  Finding 3: Invalid Traffic – The Bots That Looked Like Genuine Viewers Invalid traffic on OTT does not look like a flood of suspicious clicks. In this campaign, it showed up in three distinct forms.  1. Outdated OS signals: Devices running Android versions 5.0, 5.1, and 6.0 were generating ad requests in December 2025. These are operating system versions that are years past their support lifecycle. 2. Outdated browser signals: Smart TV devices were detected running browser versions from nearly a decade ago, like Chrome 53 and Chrome 68. In-use CTV devices do not carry browser fingerprints this outdated. These signals point clearly to spoofed or manipulated device identities.    3. Data Center IP activity: A subset of traffic was traced to IP addresses belonging to data centers and VPN infrastructure providers. These IPs were routing traffic to mimic genuine viewer behavior, appearing to originate from real residential locations while actually passing through commercial data center networks.  Action Taken to Reduce Bot Traffic Each signal was evaluated in real time as part of the VAST-level ad traffic validation process. Requests carrying bot traffic indicators were flagged and blocked before an impression was served.   Impact  On Platform A, invalid traffic stayed between 0.55% and 0.67% across the quarter.   On Platform B, despite higher inventory variability, IVT was actively contained through continuous real-time filtering.  Zero IVT-affected impressions were passed through as billable delivery across either platform, every impression that was counted was a genuine one.  As a result, once all three layers of validation were in place, the campaign delivered exactly what it was planned to. Viewability held above 92% throughout the quarter. Geographic delivery aligned closely with targeting intent; regional campaigns delivered impressions in their intended language markets. Moreover, CTV advertising accounted for nearly 99.9% of delivery across both platforms, confirming the campaign was genuinely reaching the living room screen it was built for.  Why is Ad Traffic Validation Non-Negotiable for OTT & CTV Campaigns? Frequency violations, unsafe placements, sophisticated invalid traffic – these patterns exist across OTT campaigns broadly. They go undetected simply because advertisers often don’t look at the right layer of data. Here’s what mFilterIt’s proactive ad traffic validation solution – Valid8 makes possible for brands:  Ensures your frequency cap is actually working, not just set Enforces frequency cap thresholds at the device level, so before the impression is served, overexposure is stopped before it costs you, not

What 756+ Million OTT Ad Requests Revealed About Where Media Budget Really Goes Read More »

Affiliate fraud USA

Are You Competing Against the Market or Against Your Own Affiliates?

Affiliate programs are a powerful revenue driver and bring undeniable scale and performance to the table. It’s no surprise that brands continue to increase their investment in the channel. Global affiliate marketing spend is expected to reach $17B in 2025 (up from $15.7B in 2024) and is projected to surge to $38.35B by 2030. (Source) But as investments rise, one question remains: how deeply is this performance really being evaluated? Nearly 22–30% of digital ad spend (Source) is lost to invalid traffic or fraudulent activity and affiliate campaigns are one of the easiest places for it to hide. The affiliate ecosystem is revenue-driven but complex with multiple partners involved and that makes it more vulnerable to performance leakages. When some partners take credit for users you already acquired organically, you unknowingly start competing with your own growth. You know your external competitors. What you don’t see is the partner within your own ecosystem quietly draining your ad budget. These bad partners not only impact you but also steal the credit of genuine partners, impeding their growth. Sounds like a big claim? Let’s uncover it. Steady Growth or Midnight Spikes? What Affiliate Data Is Telling You Your genuine affiliate partners will show a steady and explainable growth pattern. The installs and traffic driven by them will not be restricted to a specific time window or sudden spikes. Instead, you will see natural variations; some days higher, some lower based on seasonality, campaign activity, and normal user behaviour, making the performance look realistic and trustworthy. Whereas, in case of fraudulent affiliates, you will notice a sudden spike in the number of installs. The user journey will not be mapped, and apps can get installed on always-on basis especially during the times when no normal person will install your app (3-4 am). From a marketer’s perspective, sudden out performance without clear explanation often signals inflated or manipulated metrics, not real user acquisition. The graph below shows the exact odd-hours spike happening at peak night where y-axis highlights the install rate and x-axis, the time in hours. How is Wrong Affiliate Intervention Rewriting your Growth Story? You built a strong affiliate network but what if it is rewriting your growth story? Affiliates that do not bring valid traffic and yet win the attribution race are actually not contributing to your ROI. Here’s what the wrong affiliate intervention looks like – This data of 7 days indicates campaign performance of various affiliates. In just seven days of campaign data, the gap between clicks and installs shows major discrepancies. One partner alone generated 29.03 million clicks but delivered only 45,501 installs, an extremely low 0.16% click-to-install rate while others also failed to cross even the 1% install rate mark. On the surface, the program appears to be scaling through massive traffic, but in reality, the growth narrative is being shaped by inflated clicks rather than real users, distorting performance, budgets, and optimization decisions. From Attributed Performance to Real Incrementality: The Shift You Need This time, you are not required to increase the budget of affiliate programs, instead what you require is a comprehensive approach that provides right attribution to deserving partners, cutting noise of fraudulent affiliates. Here’s how mFilterit’s holistic ad fraud solution Valid8, empowers your brands with an added layer of attribution integrity – Eliminate odd-hour install spikes by closely monitoring the full user journey and identifying suspicious patterns at the source level before they drain your budget. Demand true source-level transparency to shift budgets toward partners delivering genuine installs and cut spend on hidden, low-quality traffic sources. Detect traffic quality issues and behavioural anomalies early to optimise campaigns toward high-intent users instead of inflated performance numbers. Automate blocking, protect payouts, and optimise partner performance to reduce wasted spend, safeguard ROI, and scale confidently with partners that truly drive results. How We Tracked Down IVT: Saved $1.3 Million in Just 3 Months ? For a major travel portal running performance campaigns to acquire new customers, the problem wasn’t the budget, it was the lack of visibility into where the traffic was actually coming from. Despite healthy spending, the brand could not clearly distinguish between genuine and low-quality affiliate sources. We stepped in and closely monitored affiliate performance across the program. By identifying the partners driving fraudulent and non-incremental activity and stopping payouts to them, the brand ensured that only genuine contributions were rewarded. As a result, it was able to save up to $1.3 million in just three months while bringing back control over its performance spend. Conclusion The last thing you must worry about while running an affiliate program is to fight against your own affiliates. Affiliate marketing program are not the problem; the real opportunity lies in making them work the way they are meant to. To unlock their true incremental value and eliminate dishonest contributions, brands need to evaluate the entire affiliate journey, not just the final attribution. Only then they can fight affiliate marketing fraud and reward genuine partners, stop performance leakages, and turn the channel into a reliable, growth-driving engine. Want to know how? Schedule a call! FAQs How Can You Tell If An Affiliate Is Driving Real Growth? Real affiliates show consistent, natural performance trends. Sudden install spikes, odd-hour conversions, or a big gap between clicks and installs are signs of non-incremental or low-quality traffic. Why Do Affiliate Programs Sometimes Waste Ad Budget? Because last-click attribution can reward partners who didn’t create real user intent, brands end up paying for users they would have acquired organically, leading to inflated metrics and lower ROI. How Can Brands Stop Affiliate Fraud And Protect Roi? By analysing the full user journey, identifying traffic sources, and rewarding only genuine incremental conversions while blocking invalid partners and payouts. What are the signs of affiliate fraud in campaign data? Common signs include sudden traffic spikes, odd-hour conversions, unusually high clicks with very low installs, poor click-to-install rates, and conversions from suspicious referral sources. These patterns often indicate invalid traffic or attribution of manipulation.  How can brands audit their affiliate partners effectively? Brands can evaluate affiliate partners by reviewing traffic quality, conversion behaviour, referral sources, and adherence to program guidelines. Ongoing

Are You Competing Against the Market or Against Your Own Affiliates? Read More »

How to Know If Your Campaign is Affected by Ad Fraud

How to Know If Your Campaign is Affected by Ad Fraud: 5 Signs Marketers Often Miss

Bot traffic is taking up more than half of the internet traffic. Out of which, 37% of the traffic is driven by bad bots. (Source: Imperva) And this bot traffic is beyond just inflated activity.   Sophisticated ad fraud techniques penetrate the funnel, impacting not just analytics but end goals like sign-up, purchase, etc.   They can bypass basic ad fraud detection methods easily, mimicking human-like behaviour. It skews the data, further impacting decision-making, conversion rates, and retention across mobile and web campaigns.   That is why it is important for advertisers to know about not just surface-level signs of ad fraud but also the sophisticated indicators.   In this article, we’ll break down some of the signs of ad fraud that we have observed in the campaign analyzed. Let’s dig in.  What Differentiates Sophisticated Ad Fraud Techniques from Basic Bot Traffic?  Basic bot traffic is easier to detect. It often creates visible spikes like traffic coming from locations outside the targeted region, same devices, unrealistic click volumes, or abnormal engagement patterns.  On the other hand, sophisticated ad fraud is different. Instead of obvious anomalies, it mimics human-like behaviour. The manipulation happens inside patterns that are harder to identify and detect: OS distributions, CTIT inconsistencies, imperceptible ad placements, IP clustering, or traffic coming from incent fraud.  Basic bots inflate numbers. Sophisticated fraud impacts performance intelligence. That is what makes it more dangerous.  It does not just waste budget. It influences optimization decisions, attribution models, and scaling strategies, without triggering immediate suspicion. Therefore, understanding this difference is the first step toward detecting it.  Now, let’s have a look at some of the sophisticated ad fraud signals.  Sign 1: Heavy install coming from older Android OS versions  Fraudulent affiliates using bots and emulators running on older Android OS versions to generate fake app installs.   After comparing OS version install distribution across different traffic sources:  Google installs were spread across multiple OS versions (10-16), reflecting a healthy and natural user base. However, two affiliate partner sources revealed a very different pattern.  Partner A and Partner B showed a heavy concentration of installs on OS 12, 13, and 14  While the benchmark (Google) traffic was distributed more broadly across OS 10–16  The mismatch clearly indicated emulator-based or bot-driven installs.   Sign 2: Google Play installs happened before the user clicked on an ad  Click-to-install time (CTIT) measures how long it took a user to install an app after clicking on an ad.     Naturally, an app install takes up to minimum 20-30 seconds. However, in one of the campaigns we noticed app installs taking place even before the users clicked on an ad, resulting in negative CTIT. This is a clear indicator of mobile ad fraud.   Therefore, extremely short or negative click-to-install time indicates click injection.  If your CTIT distribution doesn’t resemble a natural curve, it’s worth investigating further. Know how.  Sign 3: Inflated Installs Coming From Incent App  In one of the campaigns, we observed that a telecom provider was unknowingly running ads on an incent app.  Users were redirected through a shared link, asked to install the app, and complete specific steps to earn rewards. This resulted in a high number of installs, but the actual engagement remained low.  The majority of users completed the required action only to earn coins and did not return. This clearly indicated incentive-driven traffic rather than genuine user acquisition.  Read this to know about incent apps and low-quality traffic in detail and how advertisers can protect their mobile app campaigns.   Sign 4: Invalid Traffic Coming From Imperceptible Window   In one of the web campaigns, 99% of traffic was coming from an imperceptible window (also known as pixel stuffing ) through a specific publisher source.  This means the ad was technically loaded in 0x0 iFrames, but not actually visible to users.   Although impressions and traffic volumes appeared normal, user engagement metrics clearly indicated non-human behavior. Analysis revealed:  Repetitive browser agent across sessions Over 70% of data originating from a single IP cluster Zero scroll activity and no sales generated This means advertisers must check not just if the ad was delivered but also if the ad was actually viewable.  We have broken down how to move beyond the viewability myth. Check it out here.  Sign 5: Repeated Ip Traffic From The Same Subnet (Invalid Traffic Pattern)  In genuine campaigns, IP addresses are typically distributed across diverse networks. But what we observed was different.  At first, the traffic appeared strong. But on deeper evaluation of IP-level data, we found that a large portion of clicks and visits were traced back to a single IP subnet.  Each IP was generating more than 70+ clicks, consistently inflating traffic. The concentration of activity within a contiguous subnet suggested coordinated or automated behavior rather than random user traffic.  If a significant share of your traffic is coming from closely grouped IP ranges. especially those flagged under VPN or proxy networks, it requires immediate audit.  Volume alone does not indicate performance. Source diversity does.  How Can Advertisers Identify Sophisticated Bot Traffic?   Detecting sophisticated ad fraud requires moving beyond surface-level indicators. Here are key actions advertisers should take:  Analyze Deeper Behavioral Patterns  Validating only surface-level signals like clicks and installs is not enough. You need to monitor click-to-install timing distributions, engagement depth beyond first interaction, repeat device and IP behaviour, etc. These patterns uncover anomalies that standard filters miss.  Benchmark Across Trusted Sources  Compare partner traffic against known clean channels, ecosystem adoption trends, and natural engagement ranges. Discrepancies from benchmarks often reveal non-genuine or invalid traffic behaviour.  Validate Before Scaling Budgets  Campaign scaling should never happen without ad traffic validation. High volume doesn’t mean high value. Invest in tools that provide real-time ad fraud detection, cross-source transparency and analysis, alerts for sophisticated patterns with proofs and in-depth understanding of new emerging patterns as well. At mFilterIt, our ad fraud detection tool – Valid8, helps detect ad fraud signals that ad platforms and MMPs often overlook. They also allow you to:  Understand true user intent Exclude invalid traffic before optimization

How to Know If Your Campaign is Affected by Ad Fraud: 5 Signs Marketers Often Miss Read More »

Scroll to Top